Audiences
Who is your audience?
The audiences for this project is set to be college/high school students, who are starting to get exposed to the idea of renewable energy and the environmental challenges that we currently face. Please see the user persona below, for more in-depth user research.
How well you know your users?
I have gathered data sheets of the user feedback from a similar tool that was tested a year ago. My next step is to analyze the feedback and understand the pros and cons of the experience. Then to utilize the strength and improve the weaknesses for the next iteration.
How well have you tested your idea with them?
I have gotten some feedback from my peers by showing the proof of concept. The storytelling perspective of the experience needs to be refined, then to be text out again for the next iteration.
Who is your community of practice?
My advisors, my peers, and scholars from other institutions who are studying the field.
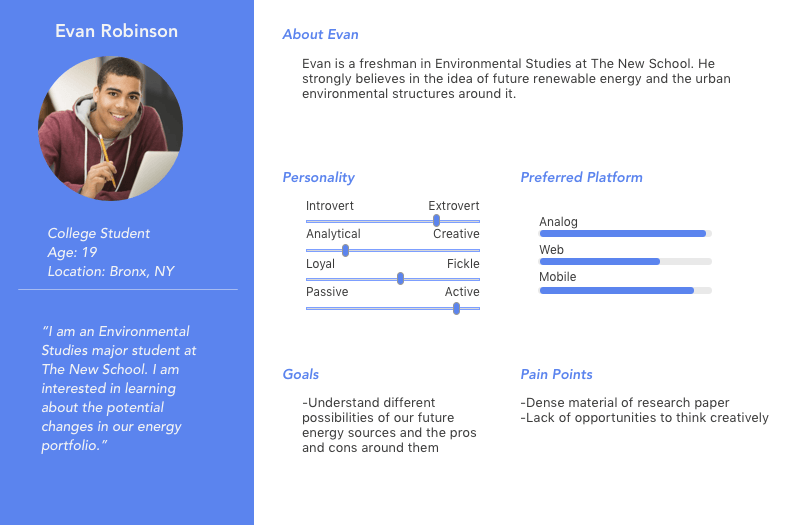
User Persona
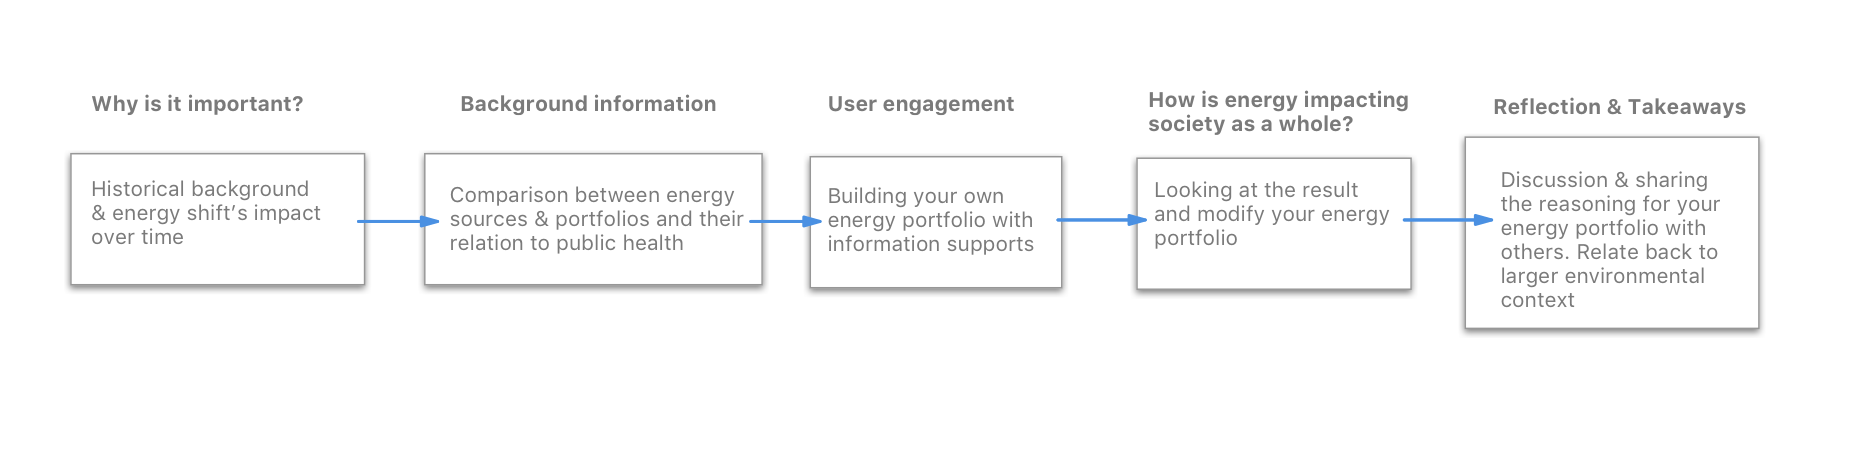
User Journey Map (For storytelling)
Prototype 1
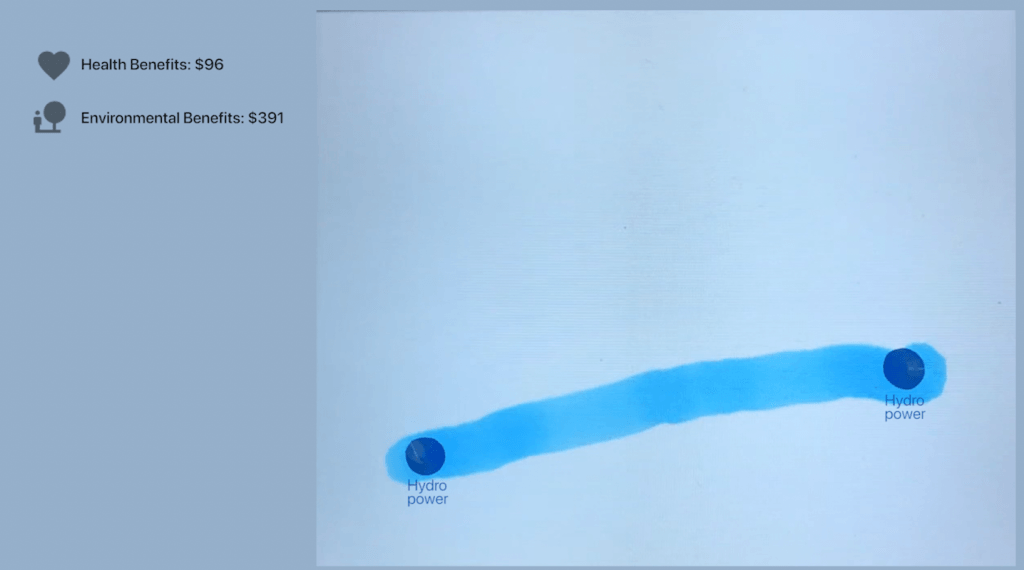
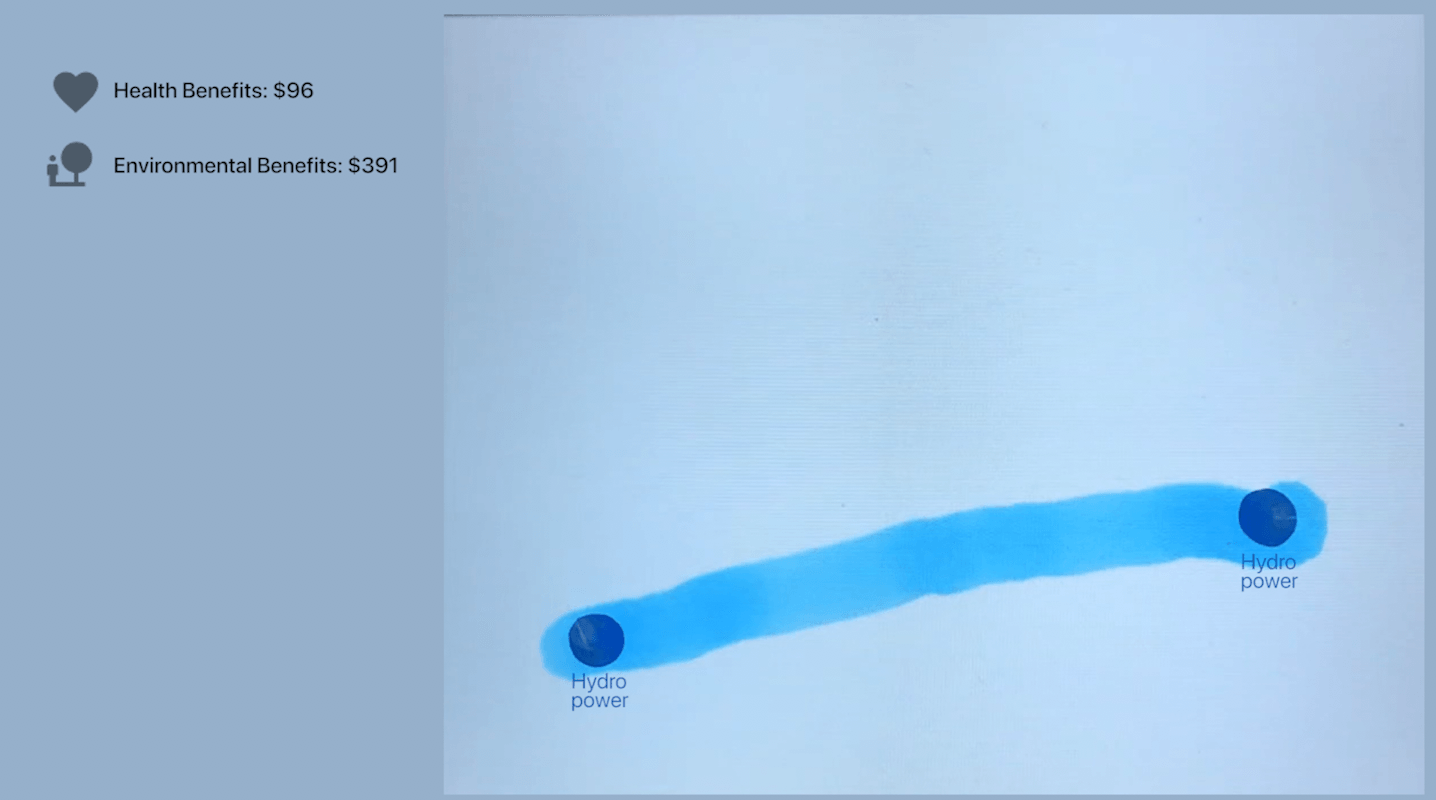
This prototype focus on the interaction of the tangible interface. The goal for this experiment is to emphasize the user engagement without presenting too much data, but rather making the visualization interesting and appealing to the audiences. In this prototype, users can place different assets on the table, once the camera recognizes the nodes, the visual will appears accordingly. Based on the different assets that are being placed on the table, the users’ decision will result in different health and environmental benefits. The relation between different elements is currently existing in this prototype as an outline. There are various opportunities can be further developed moving forward in the project development.
Each of the different types/colors of assets indicates the energy sources that are being used for the facility construction. For example, in the current prototype where blue represents urban facilities that are constructed based on hydro energy, orange represents urban facilities that are constructed based on solar energy. Multiple of them together, based on the numbers of assets that are detected on the table through open CV color tracking technology, different types of visual will show up on the table top accordingly. The two solar assets can be detected as two nodes, and then a road of solar charging path can be created in the city as a speculative form of urban facilities. (not in prototype yet) Four green color coordinates can form a green space, that allows the area to generate wind energy while increasing the environmental benefits of the city. The ideation between these elements needs to be further developed in the upcoming month. I aim to have a complete systematic interaction flushed out by the end of February so that I could dive into the technical development of this interaction. Writing in detail explaining the design concept can be found in the essay.