


final-climate-change < link to Final infograohic PDF

Researched images for info graphic idea. ^
Symbols:
I chose to make symbols that were easy for the viewer to associate with climate change (causes and effects)

color:
I chose two bright colors that worked well with my concept of temperature. (hot and cold) I changed the opacity of these colors to achieve a range of importance in my infographic.

Experimental Type:
simple font that exemplifies the word “change”. The black and white print has a stronger message in comparison to the color print.


I enjoyed this project overall. I liked learning new ways to change font and work with graphic design. It was at first difficult to create a unified composition, where both the font, graphics and data worked together to result in a finalized print. Once I was able to come up with a color pallet and design that flowed nicely, I found the information could be read much clearer.
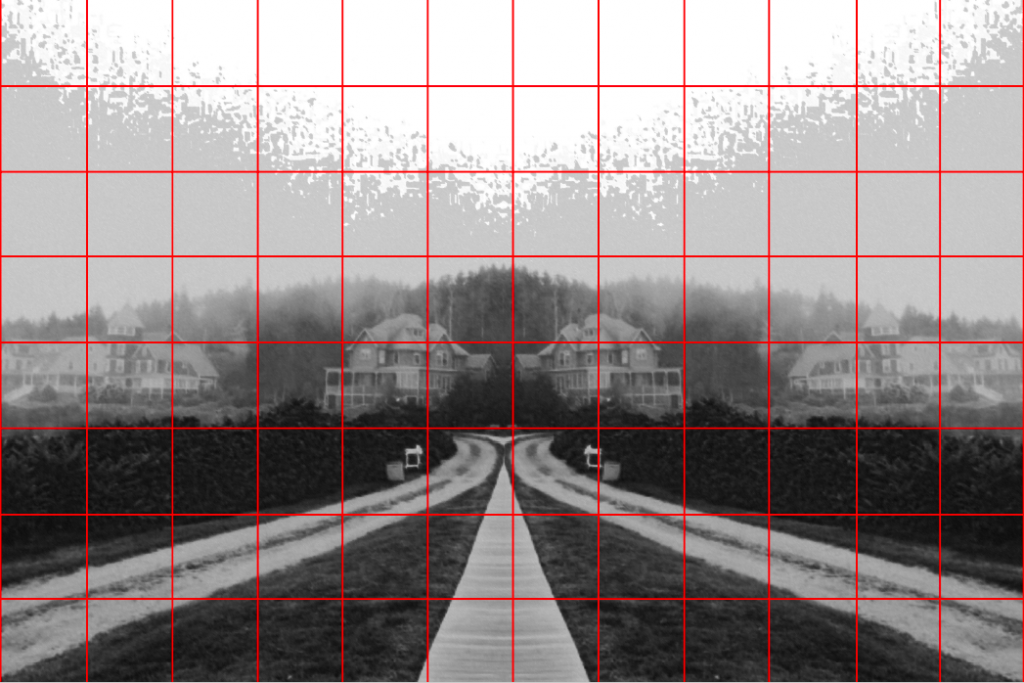
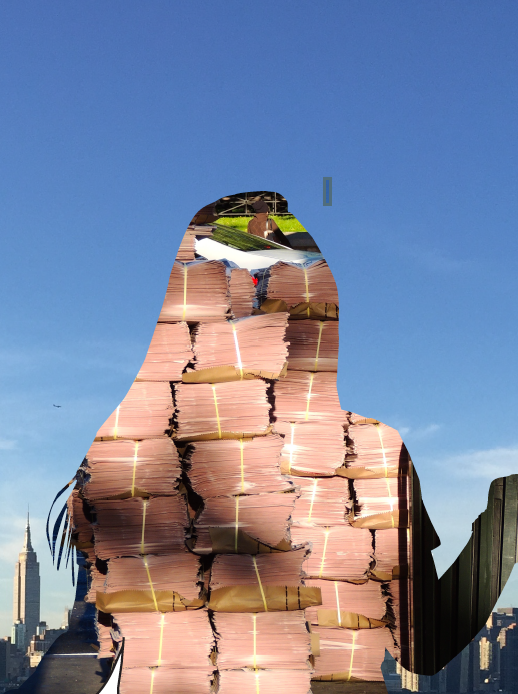
To begin the internal landscape assignment, I took the images I shot and altered them to attain a more abstract composition. After choosing one image to work with, I sized and gridded the image in order to transfer it onto a large piece of drawing paper. I proportionally scaled the grid onto the paper and lightly sketched my composition. When I continued drawing with charcoal I struggled to get refined details in parts of the image that appeared distant. I think I was successful in creating a good value range, but if I could redo this project I would try to perfect the details of my composition.