bridge_proj_1 // WIP 2
I made a basic project page with some info/resources surrounding my concept development, hosting on Github’s gh-pages. I am linking to the Cesium files through a local server, specified by node.js.
In order to create new html files that link to the Cesium API, I took out/replaced some parts of the demo files hosted on the Cesium site.
Replaced bucket.css with: widgets.css
Added script linking to: /Build/Cesium/Cesium.js
Remove the script tag for require.js and the script that calls require.config, and replace it with a link to the script: http://cesiumjs.org/releases/1.16/Build/Cesium/Cesium.js
After many silently failing attempts at parsing the data as CSV files, I finally found RouteConverter, a Java app. You drop your files in (I did as KML), and visually edit/delete the points. It looks like this:
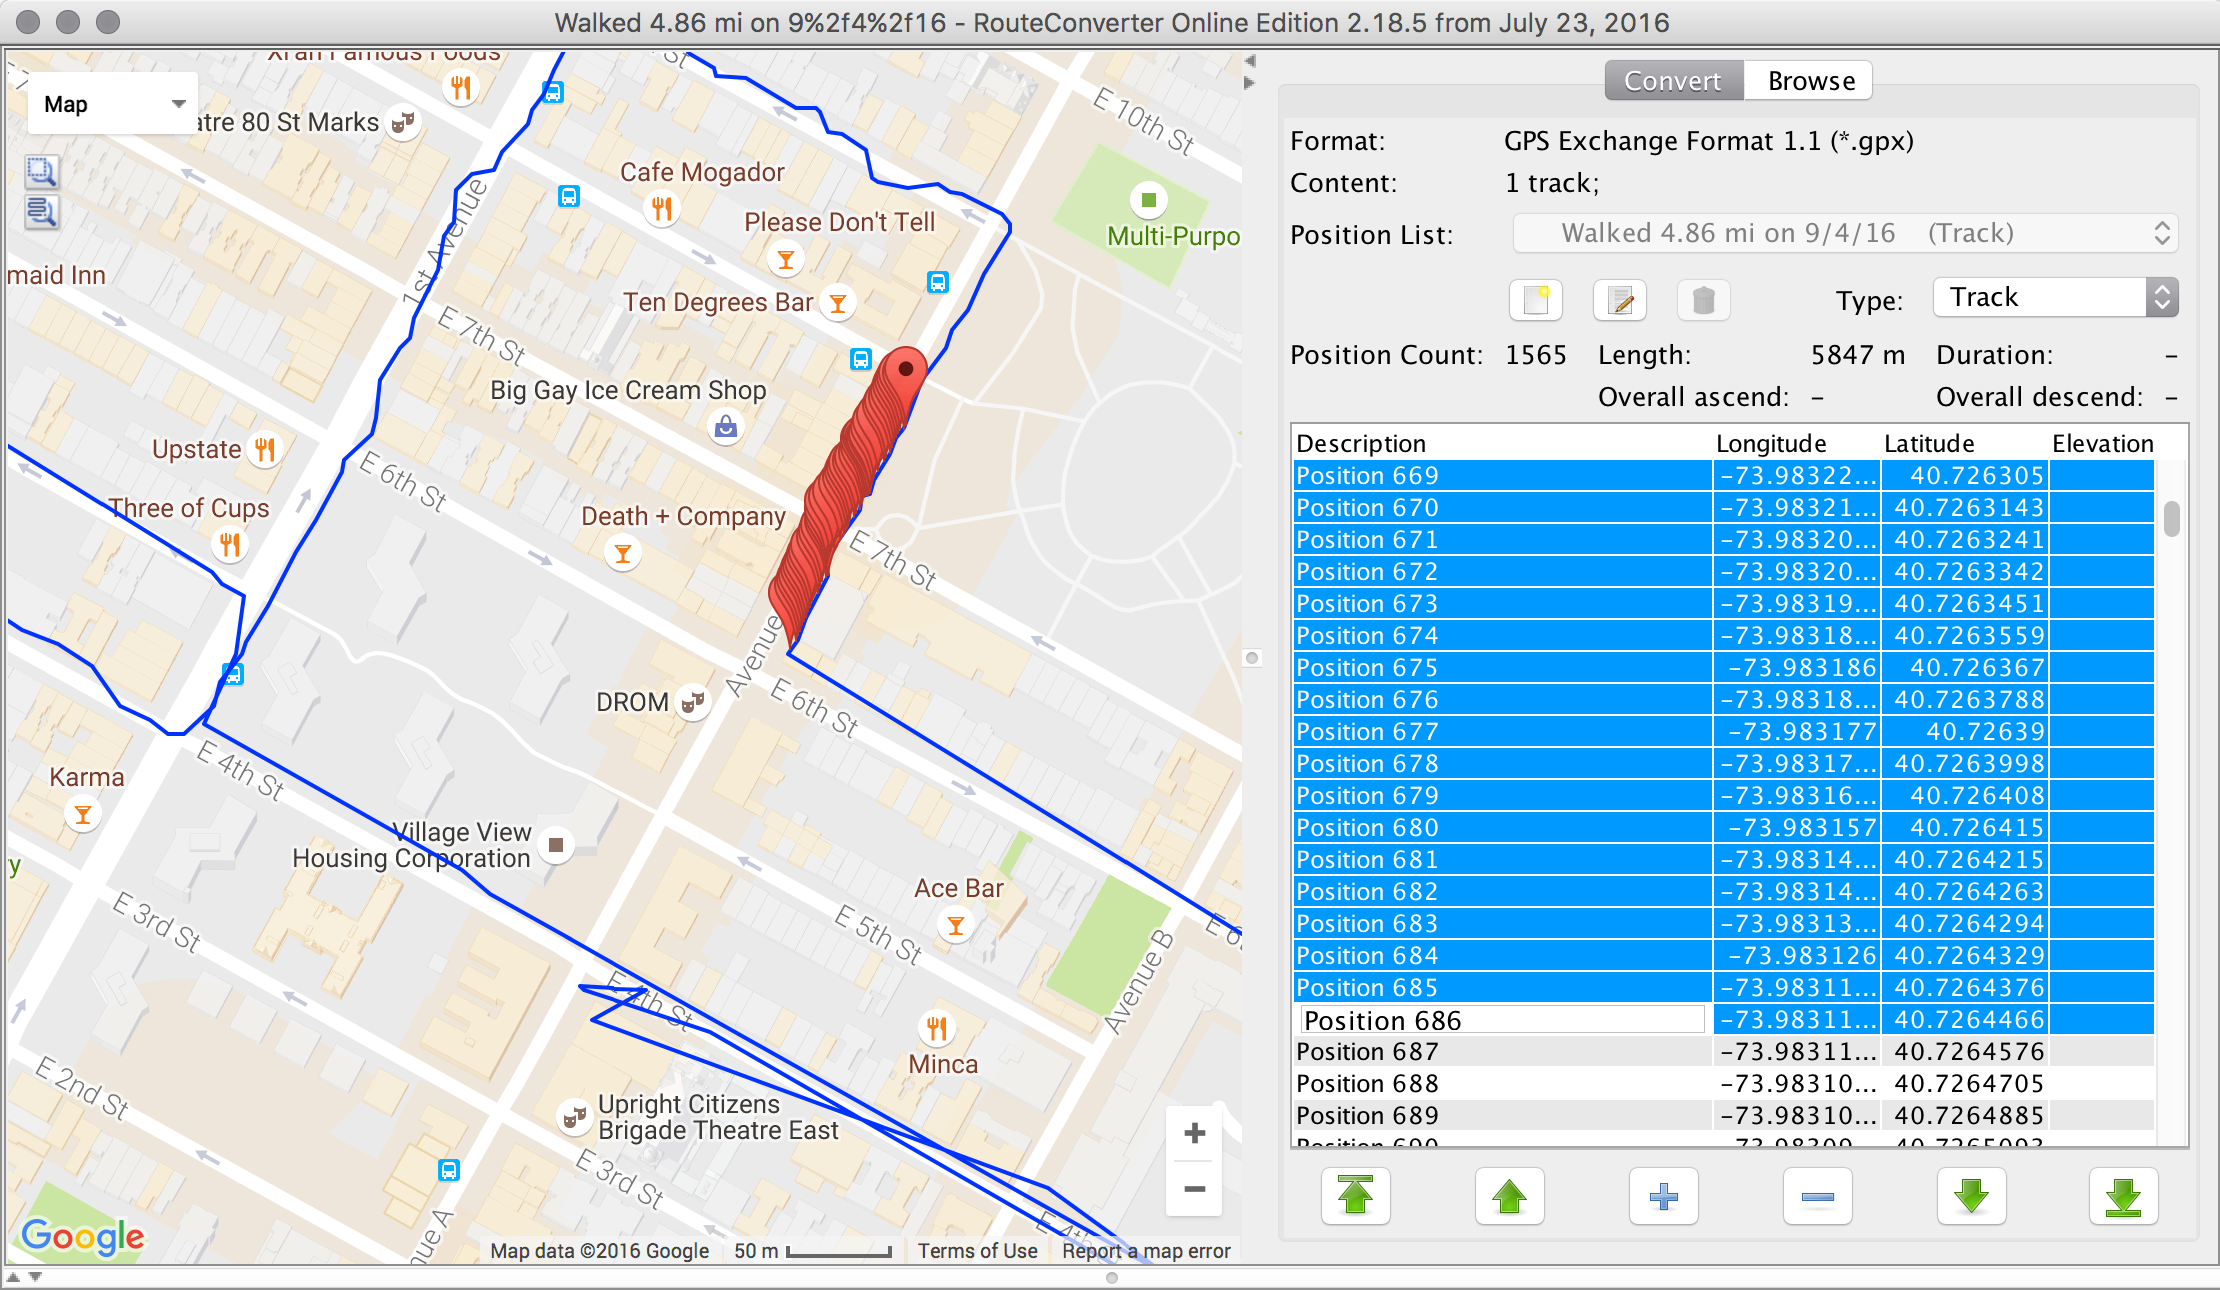
Although done manually, my files each went from 10k+ coordinate points, to ~40-50.
I was able to reformat my KML files, using example data provided by Cesium.
I would test these files by dragging them into the Cesium Viewer:
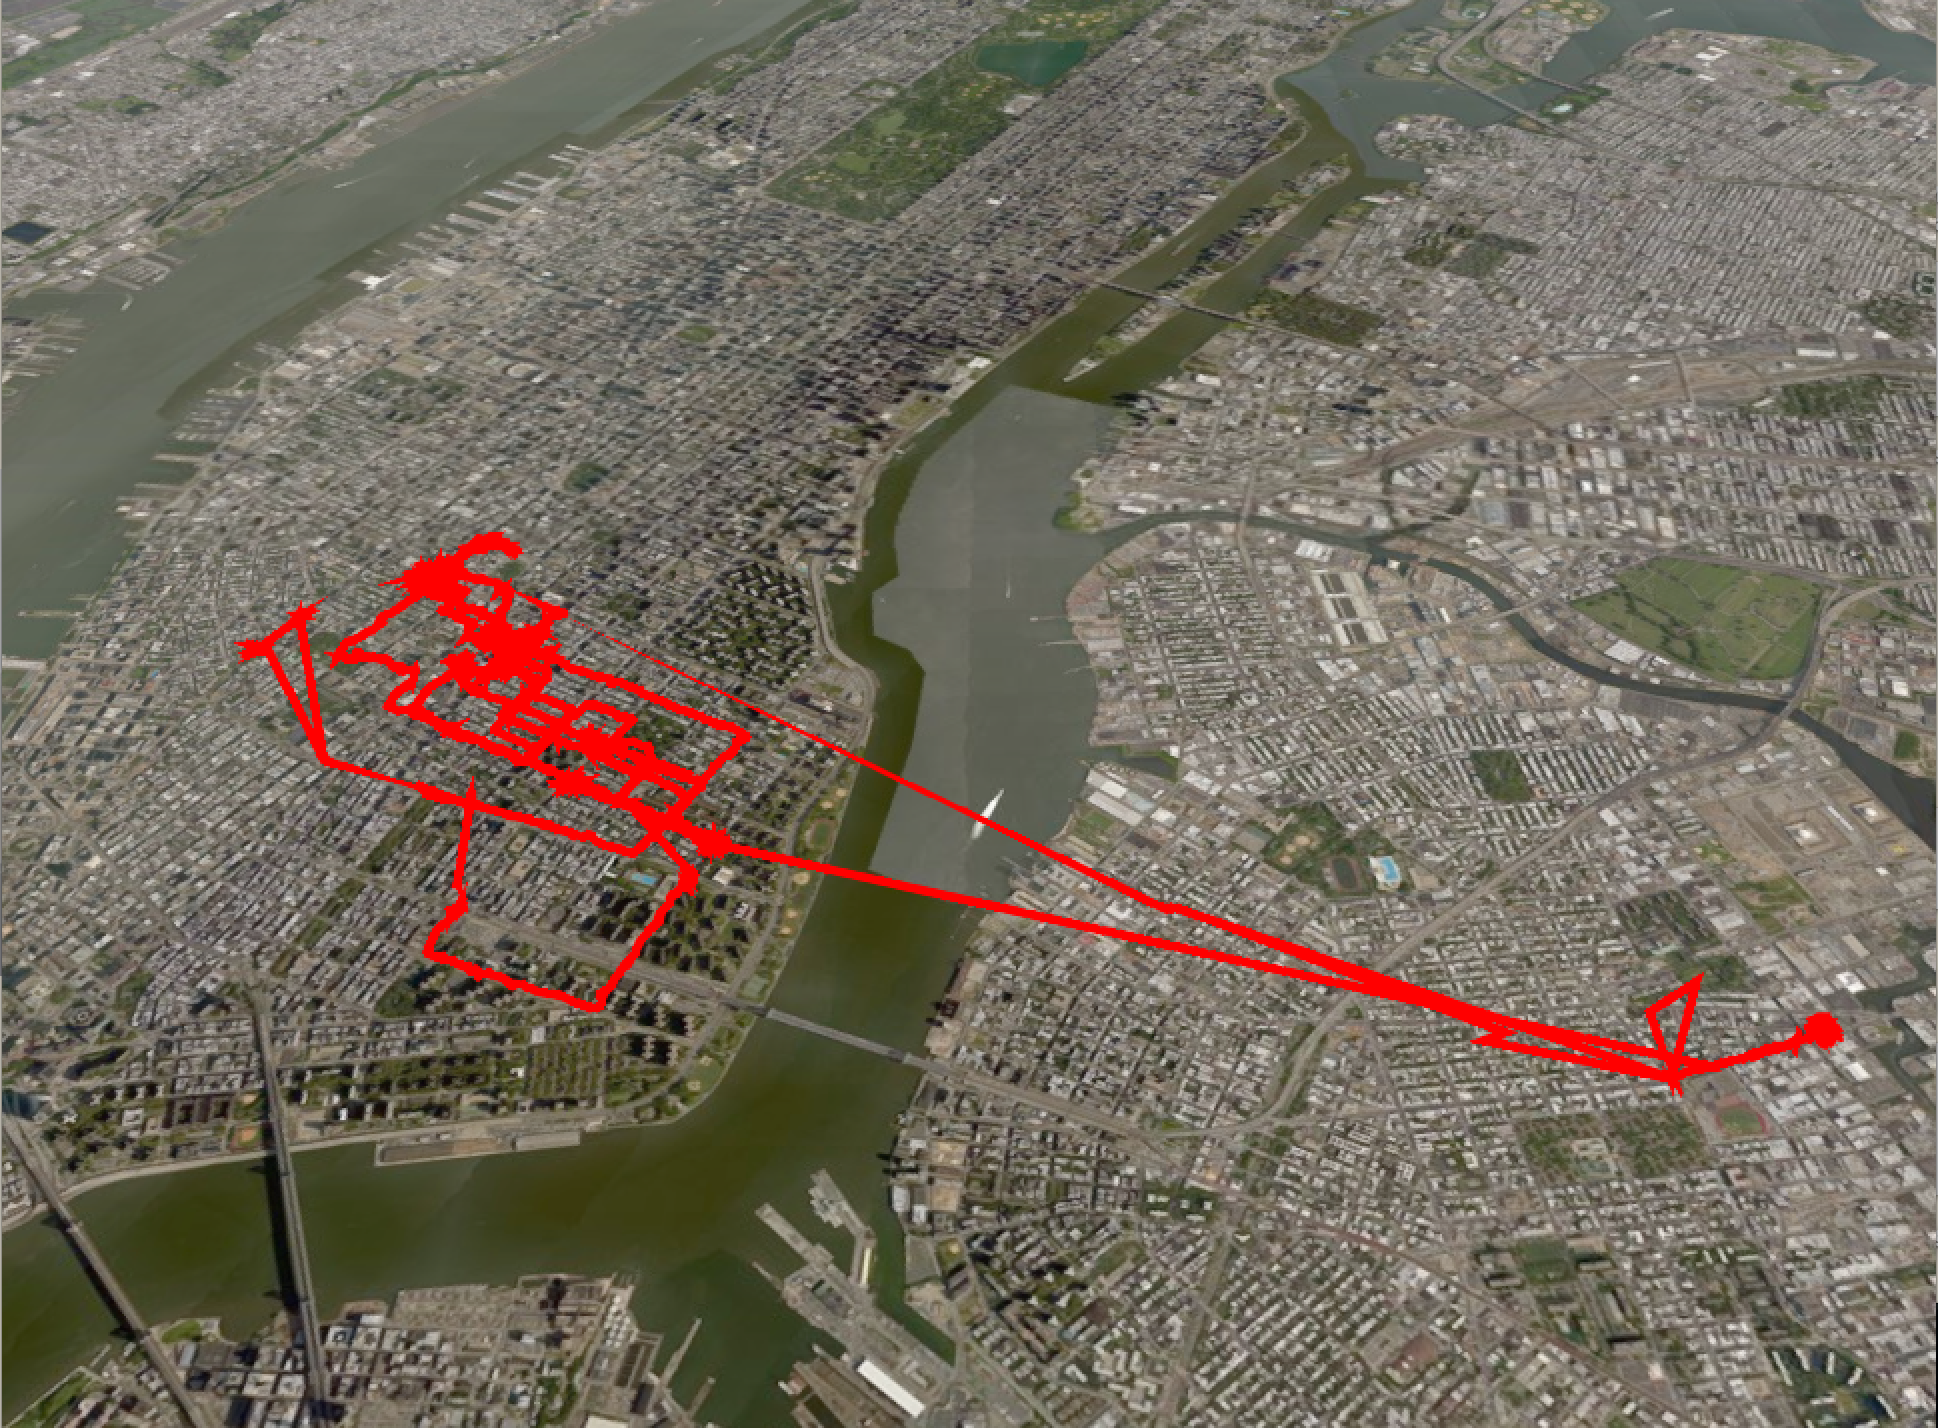
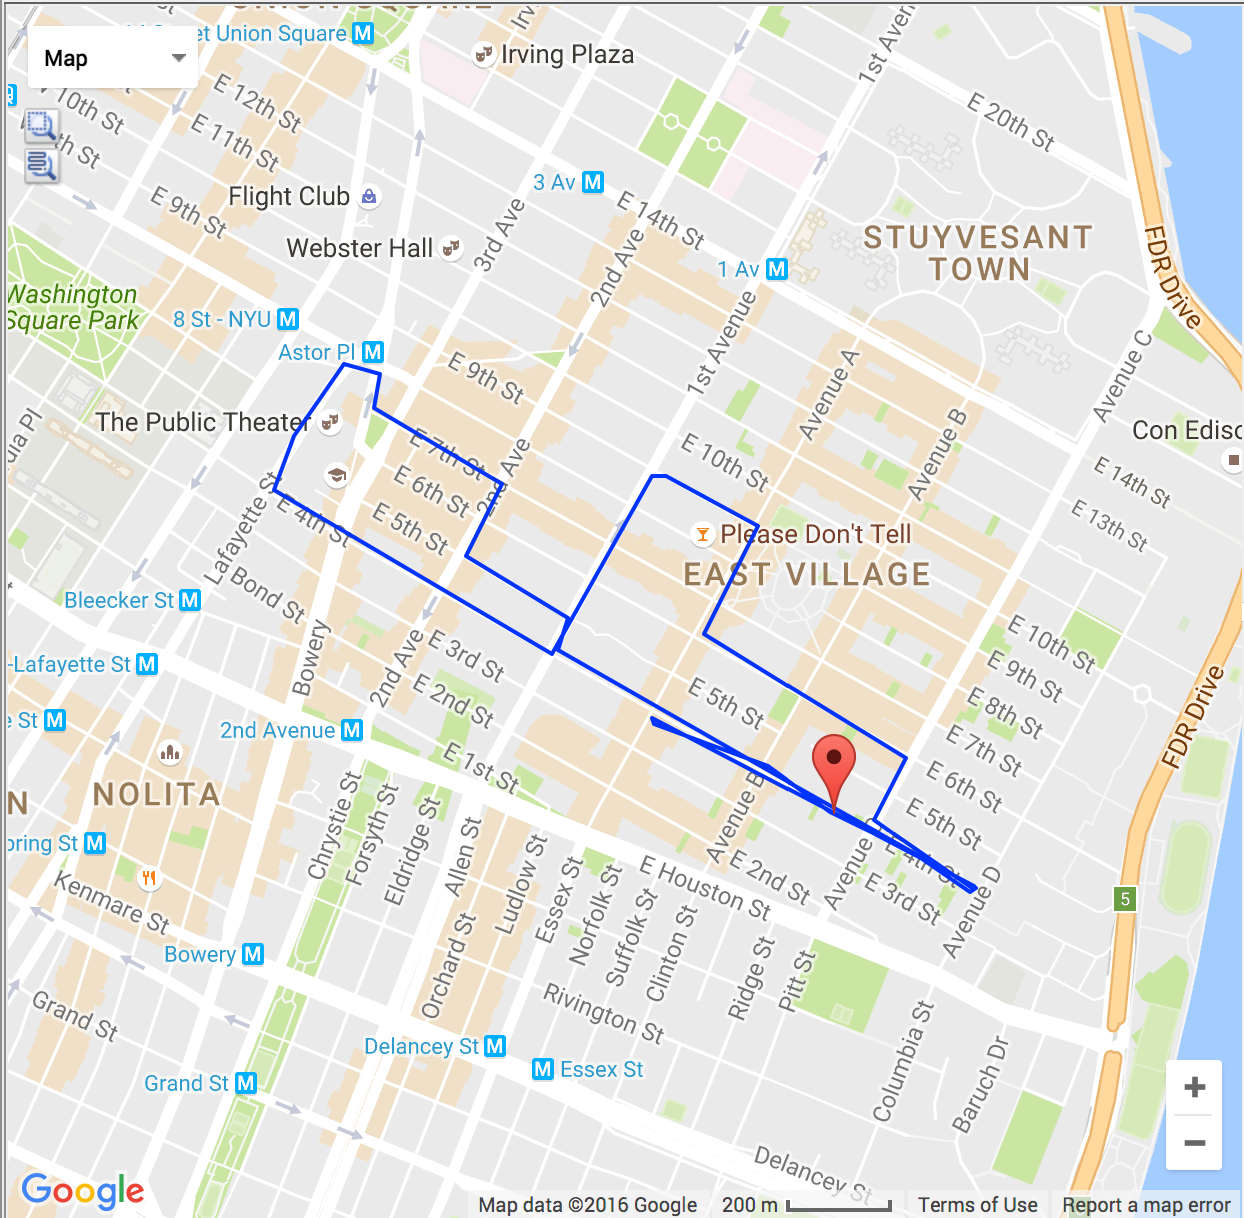
They would display as static paths, until I figured out how to manually add timestamps alongside the coordinates. These animated the path being rendered.
The problem with simplifying the coordinates and inserting time – both manually – brings us to a modified, choppy pace of the animated rendering. The pace will become more important as I add audio and more immersive visuals, but for now I’d like to hold off on that because I imagine it being extremely time-consuming, manual work. Hopefully I can find a better solution to this.