(1) Zone Walk Project
Currently, I live in the Korean Town area. Since I am very far from all color-coded zones, I decided to take an Uber west where the closest harbor is and see how the two locations differ. The circled areas are the explored routes, whereas the dotted line was the Uber ride.
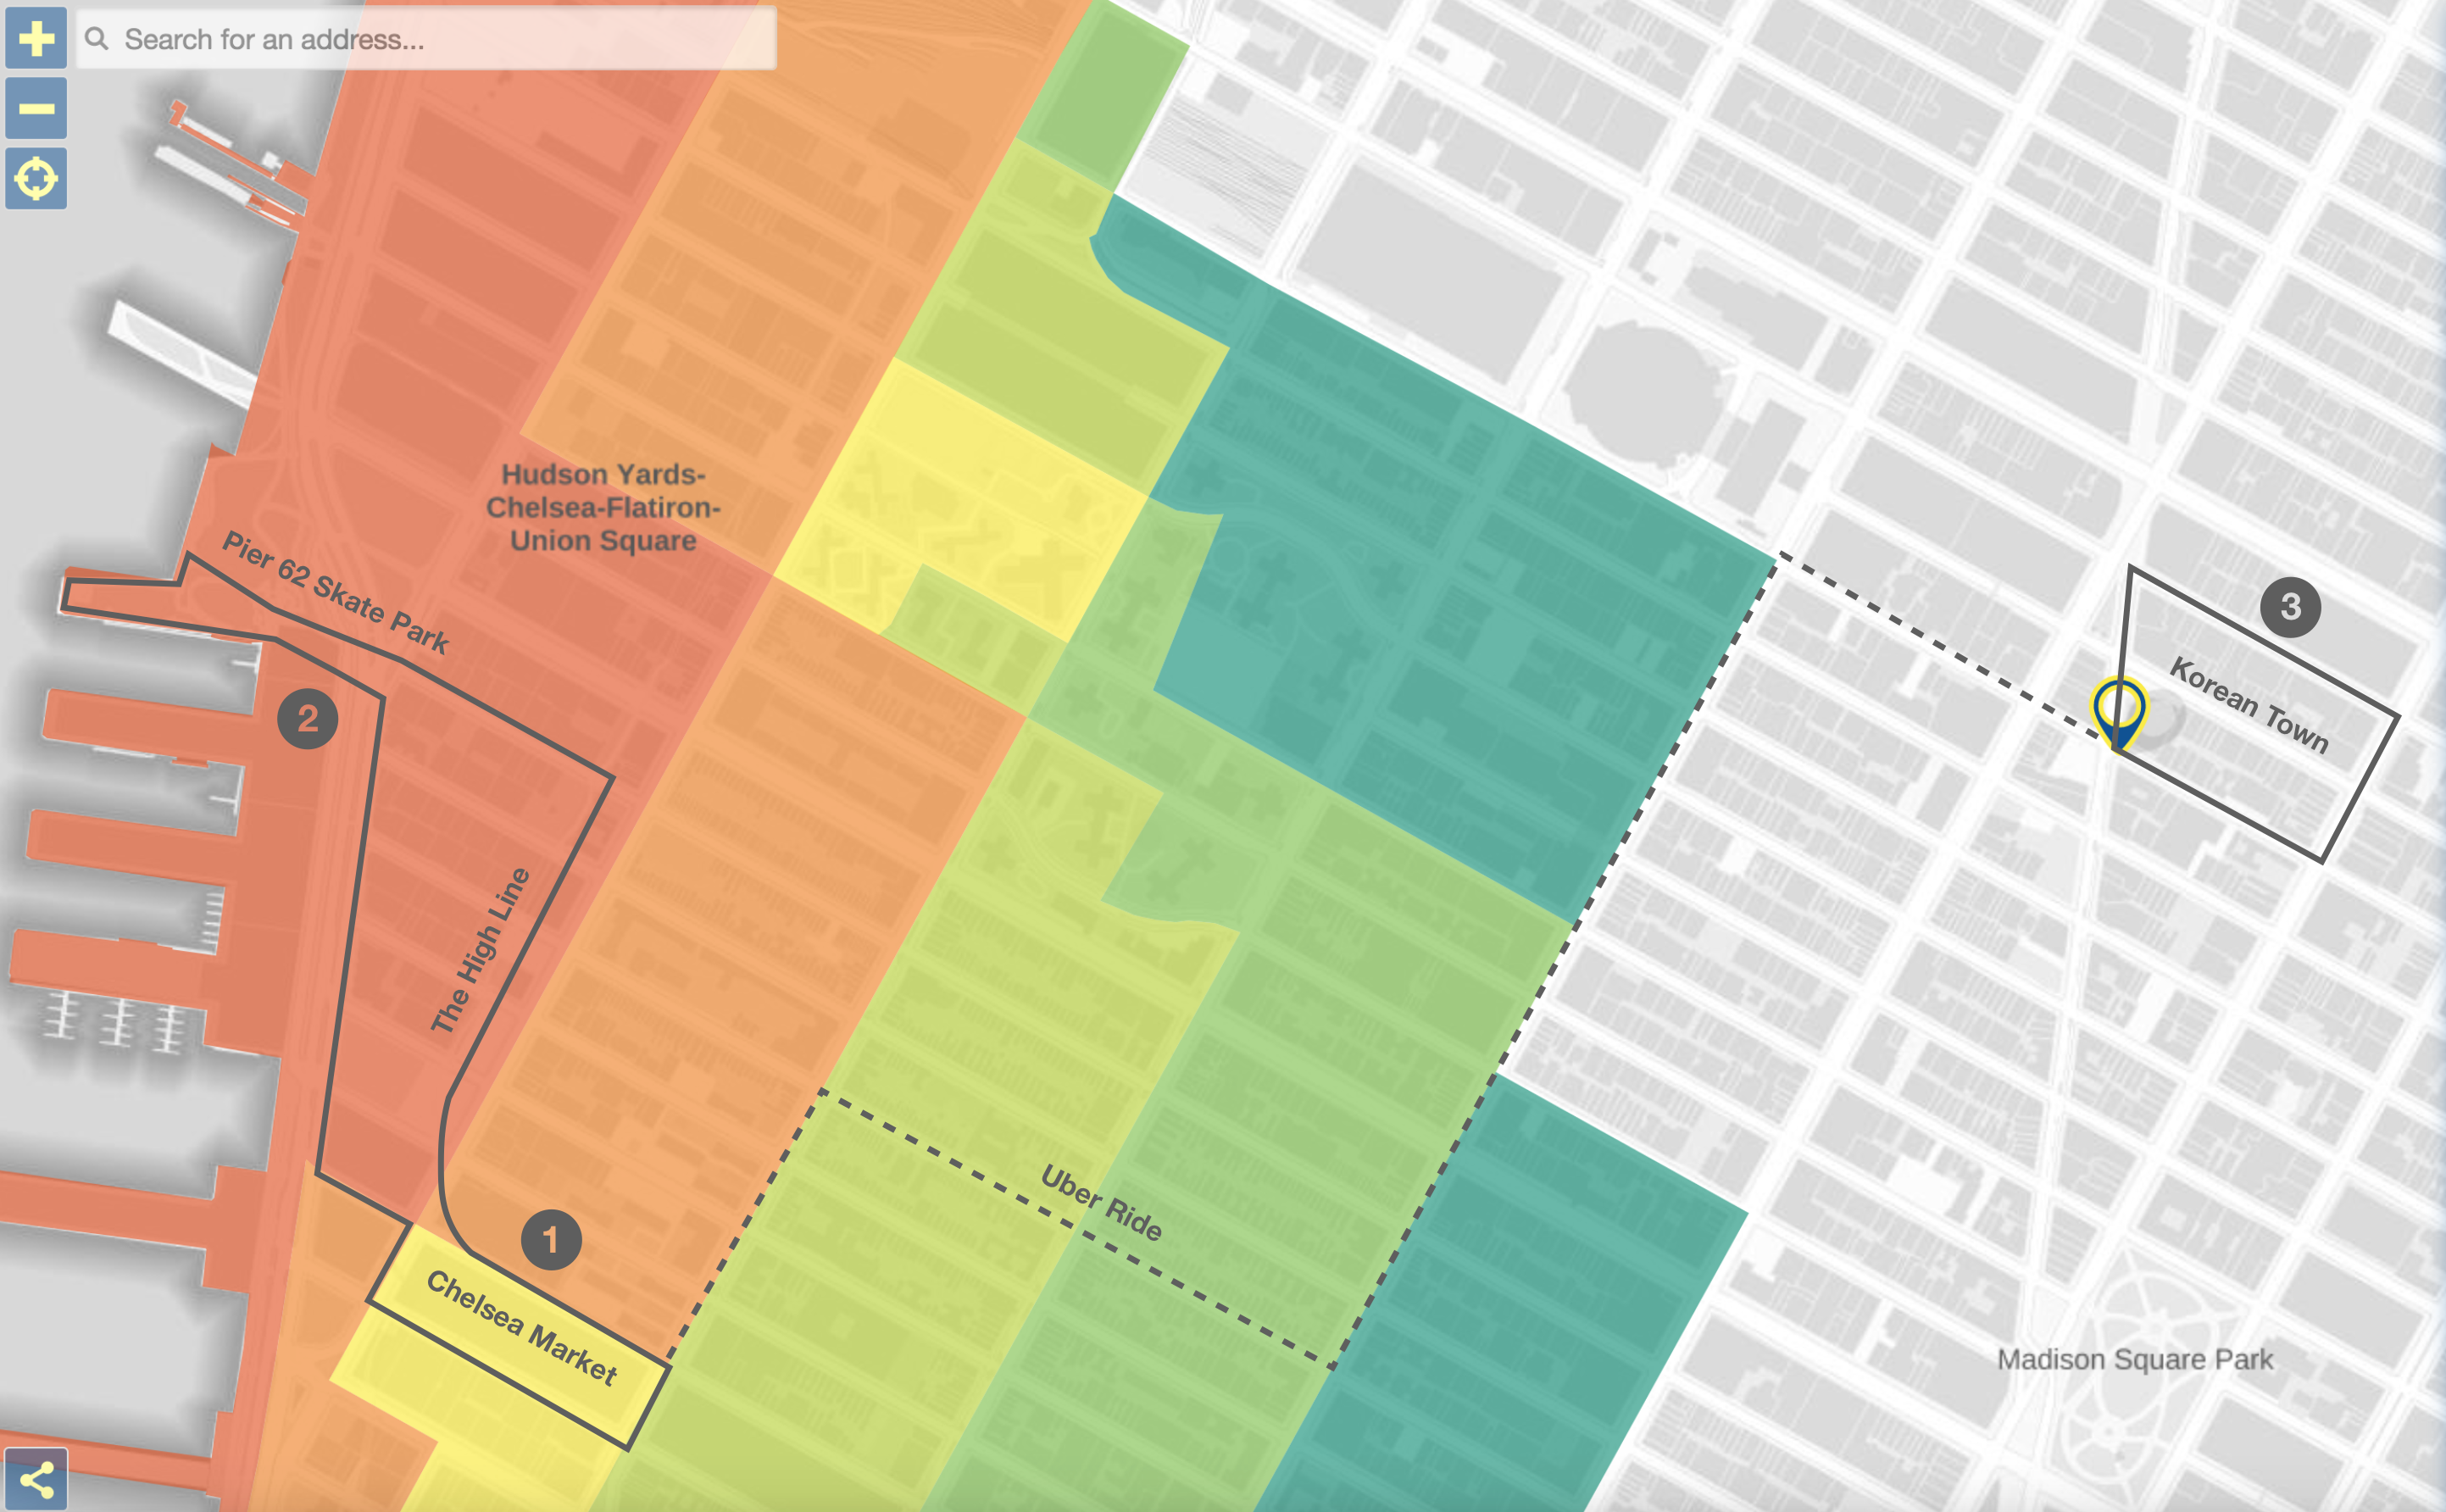
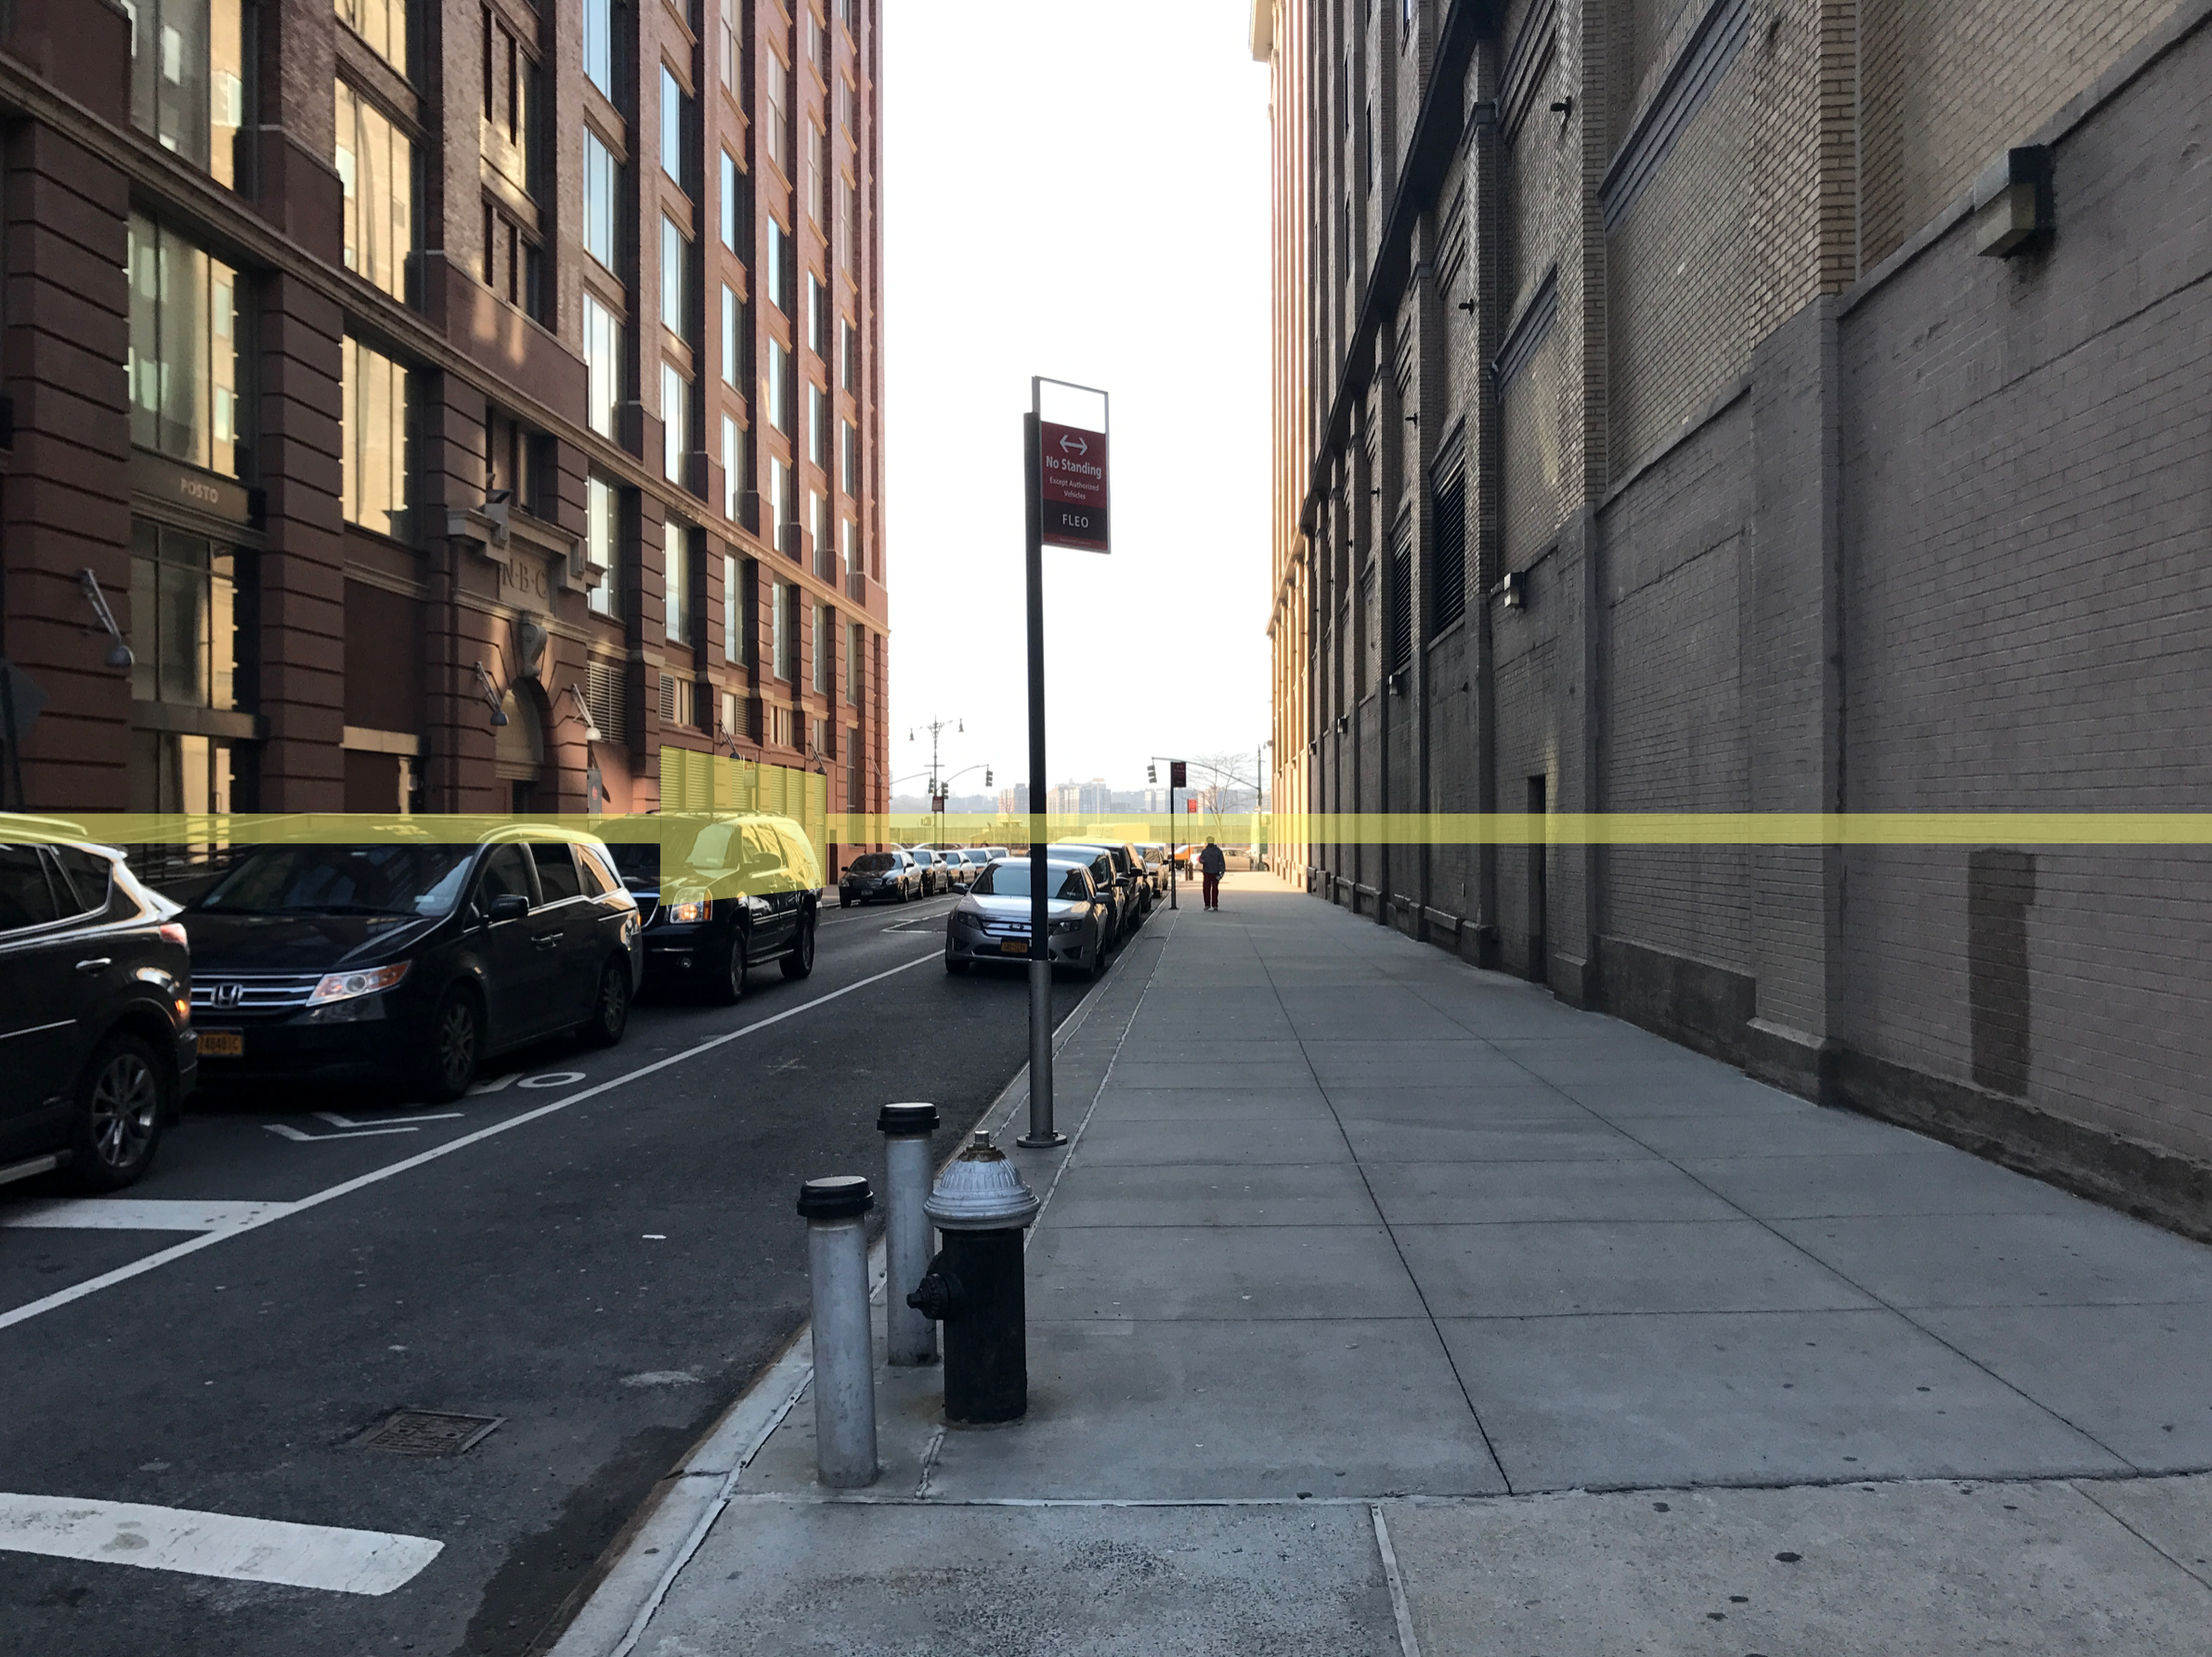
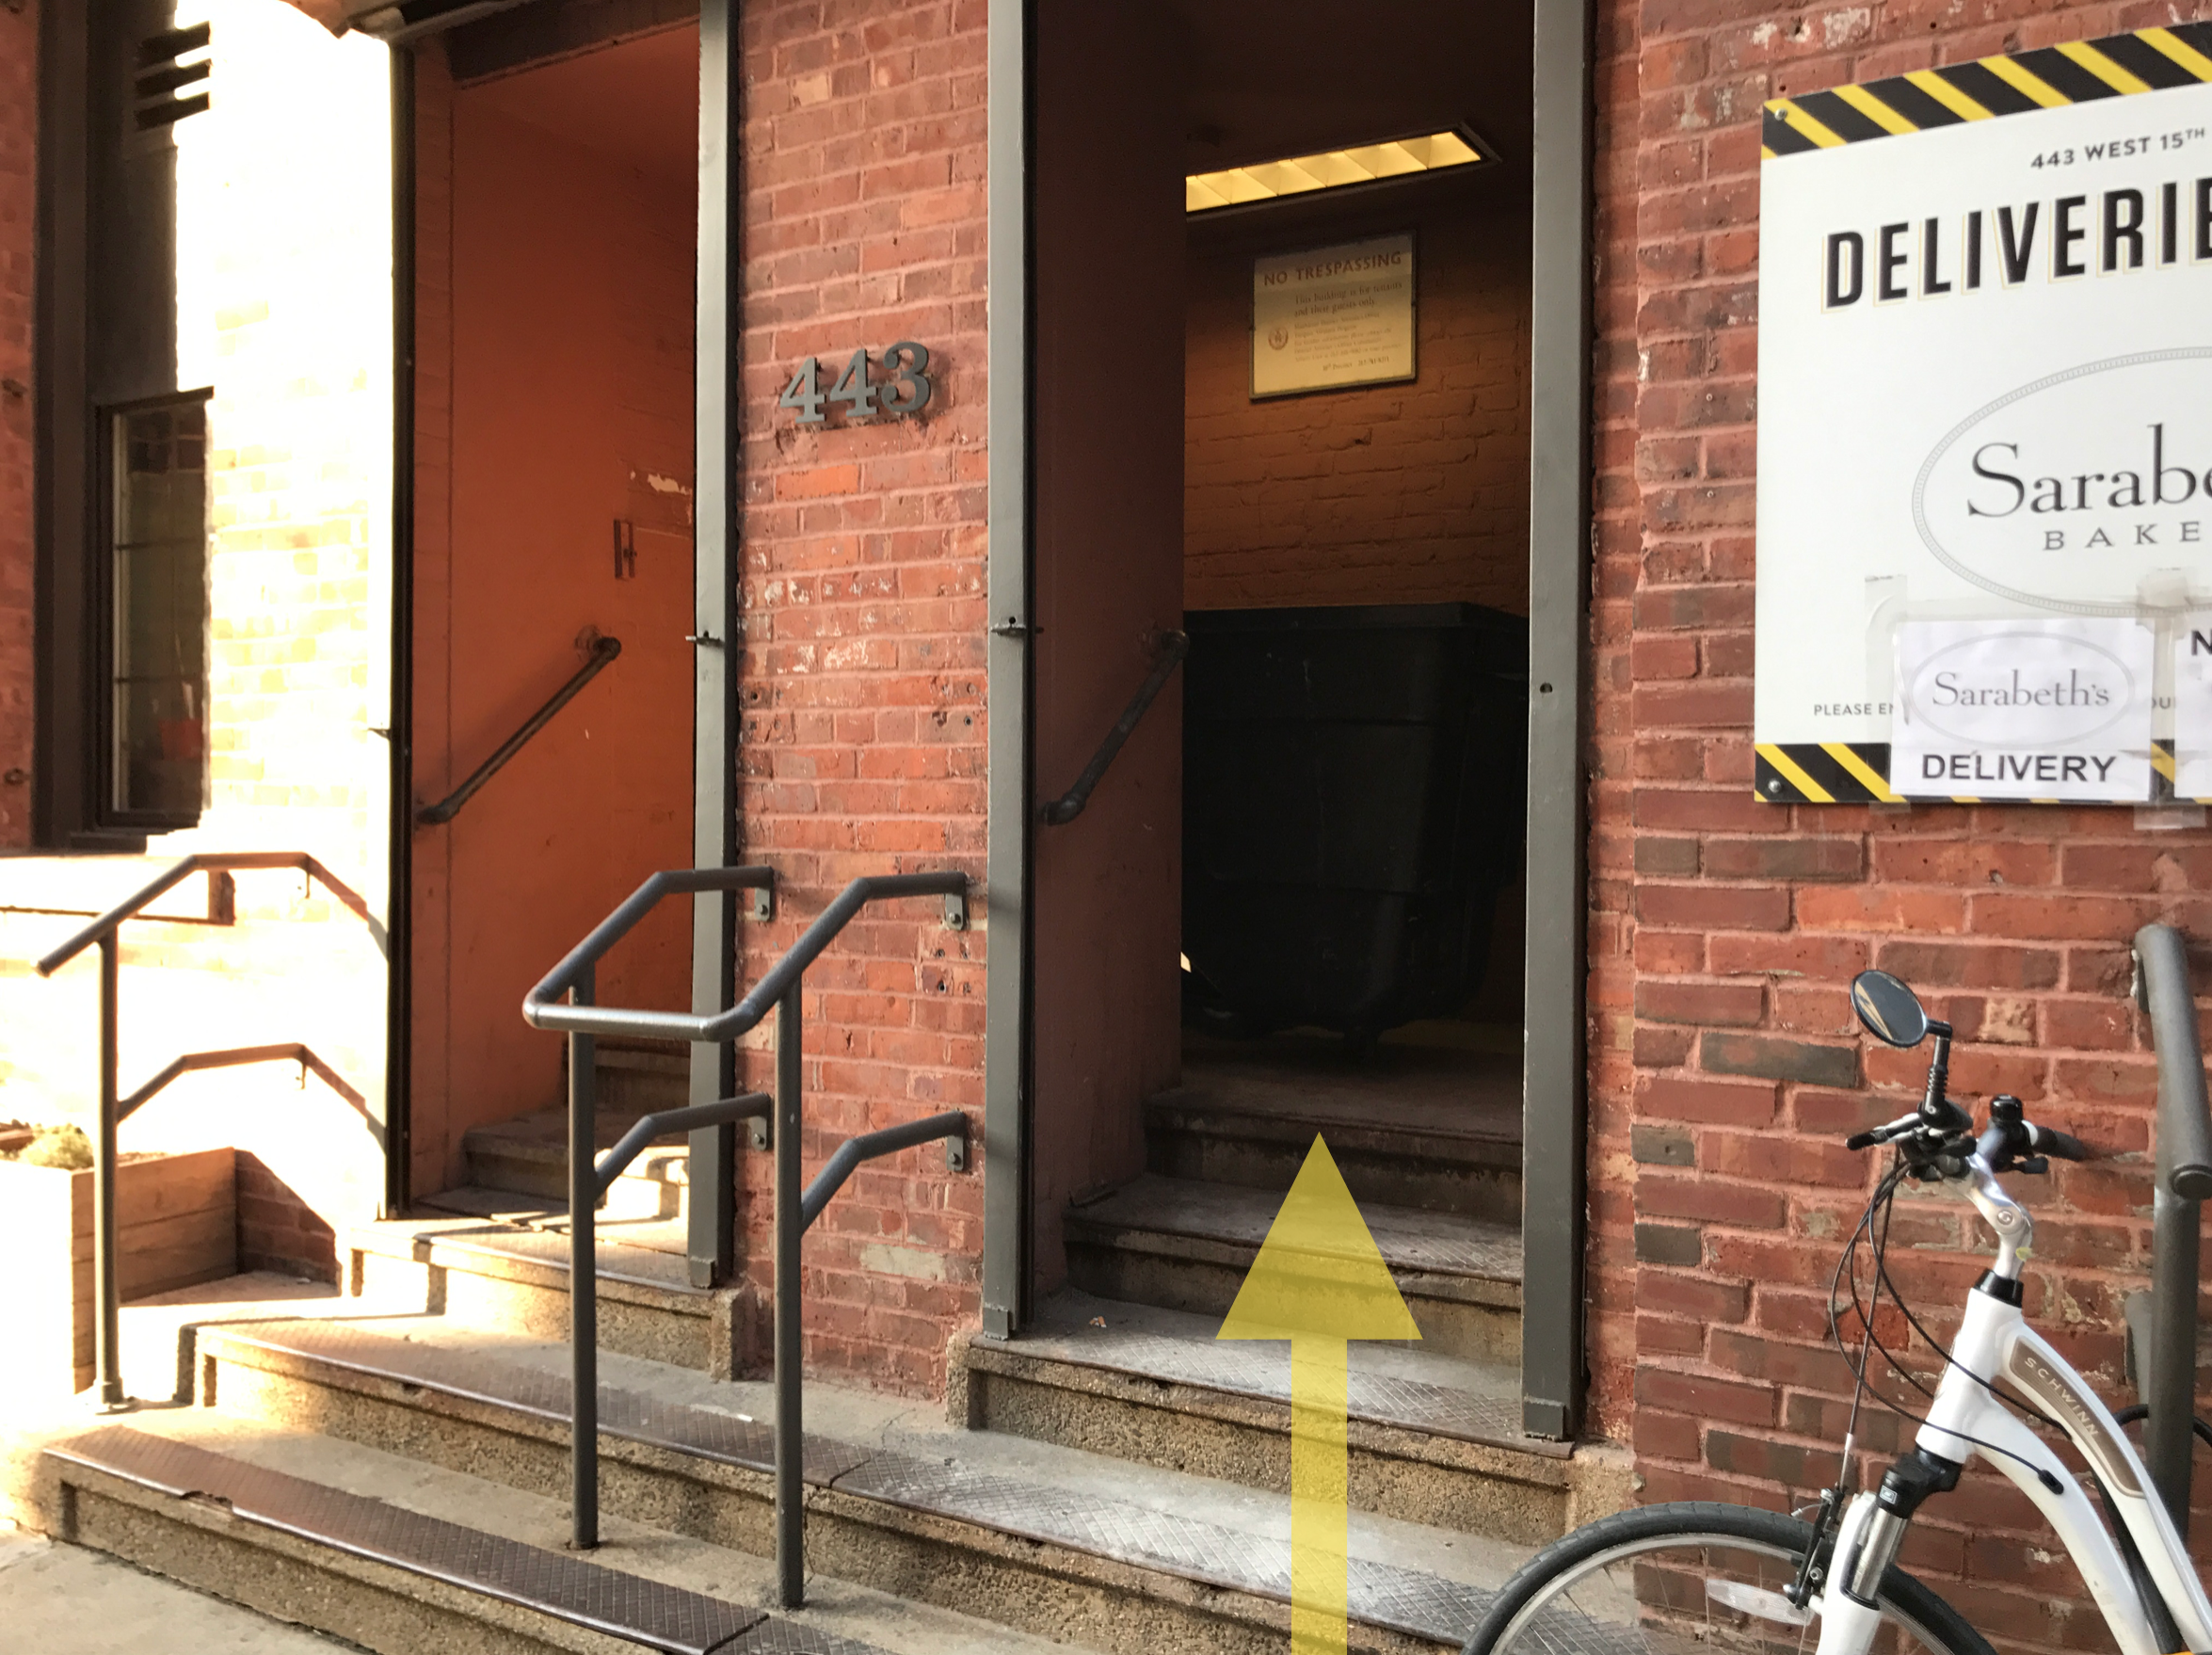
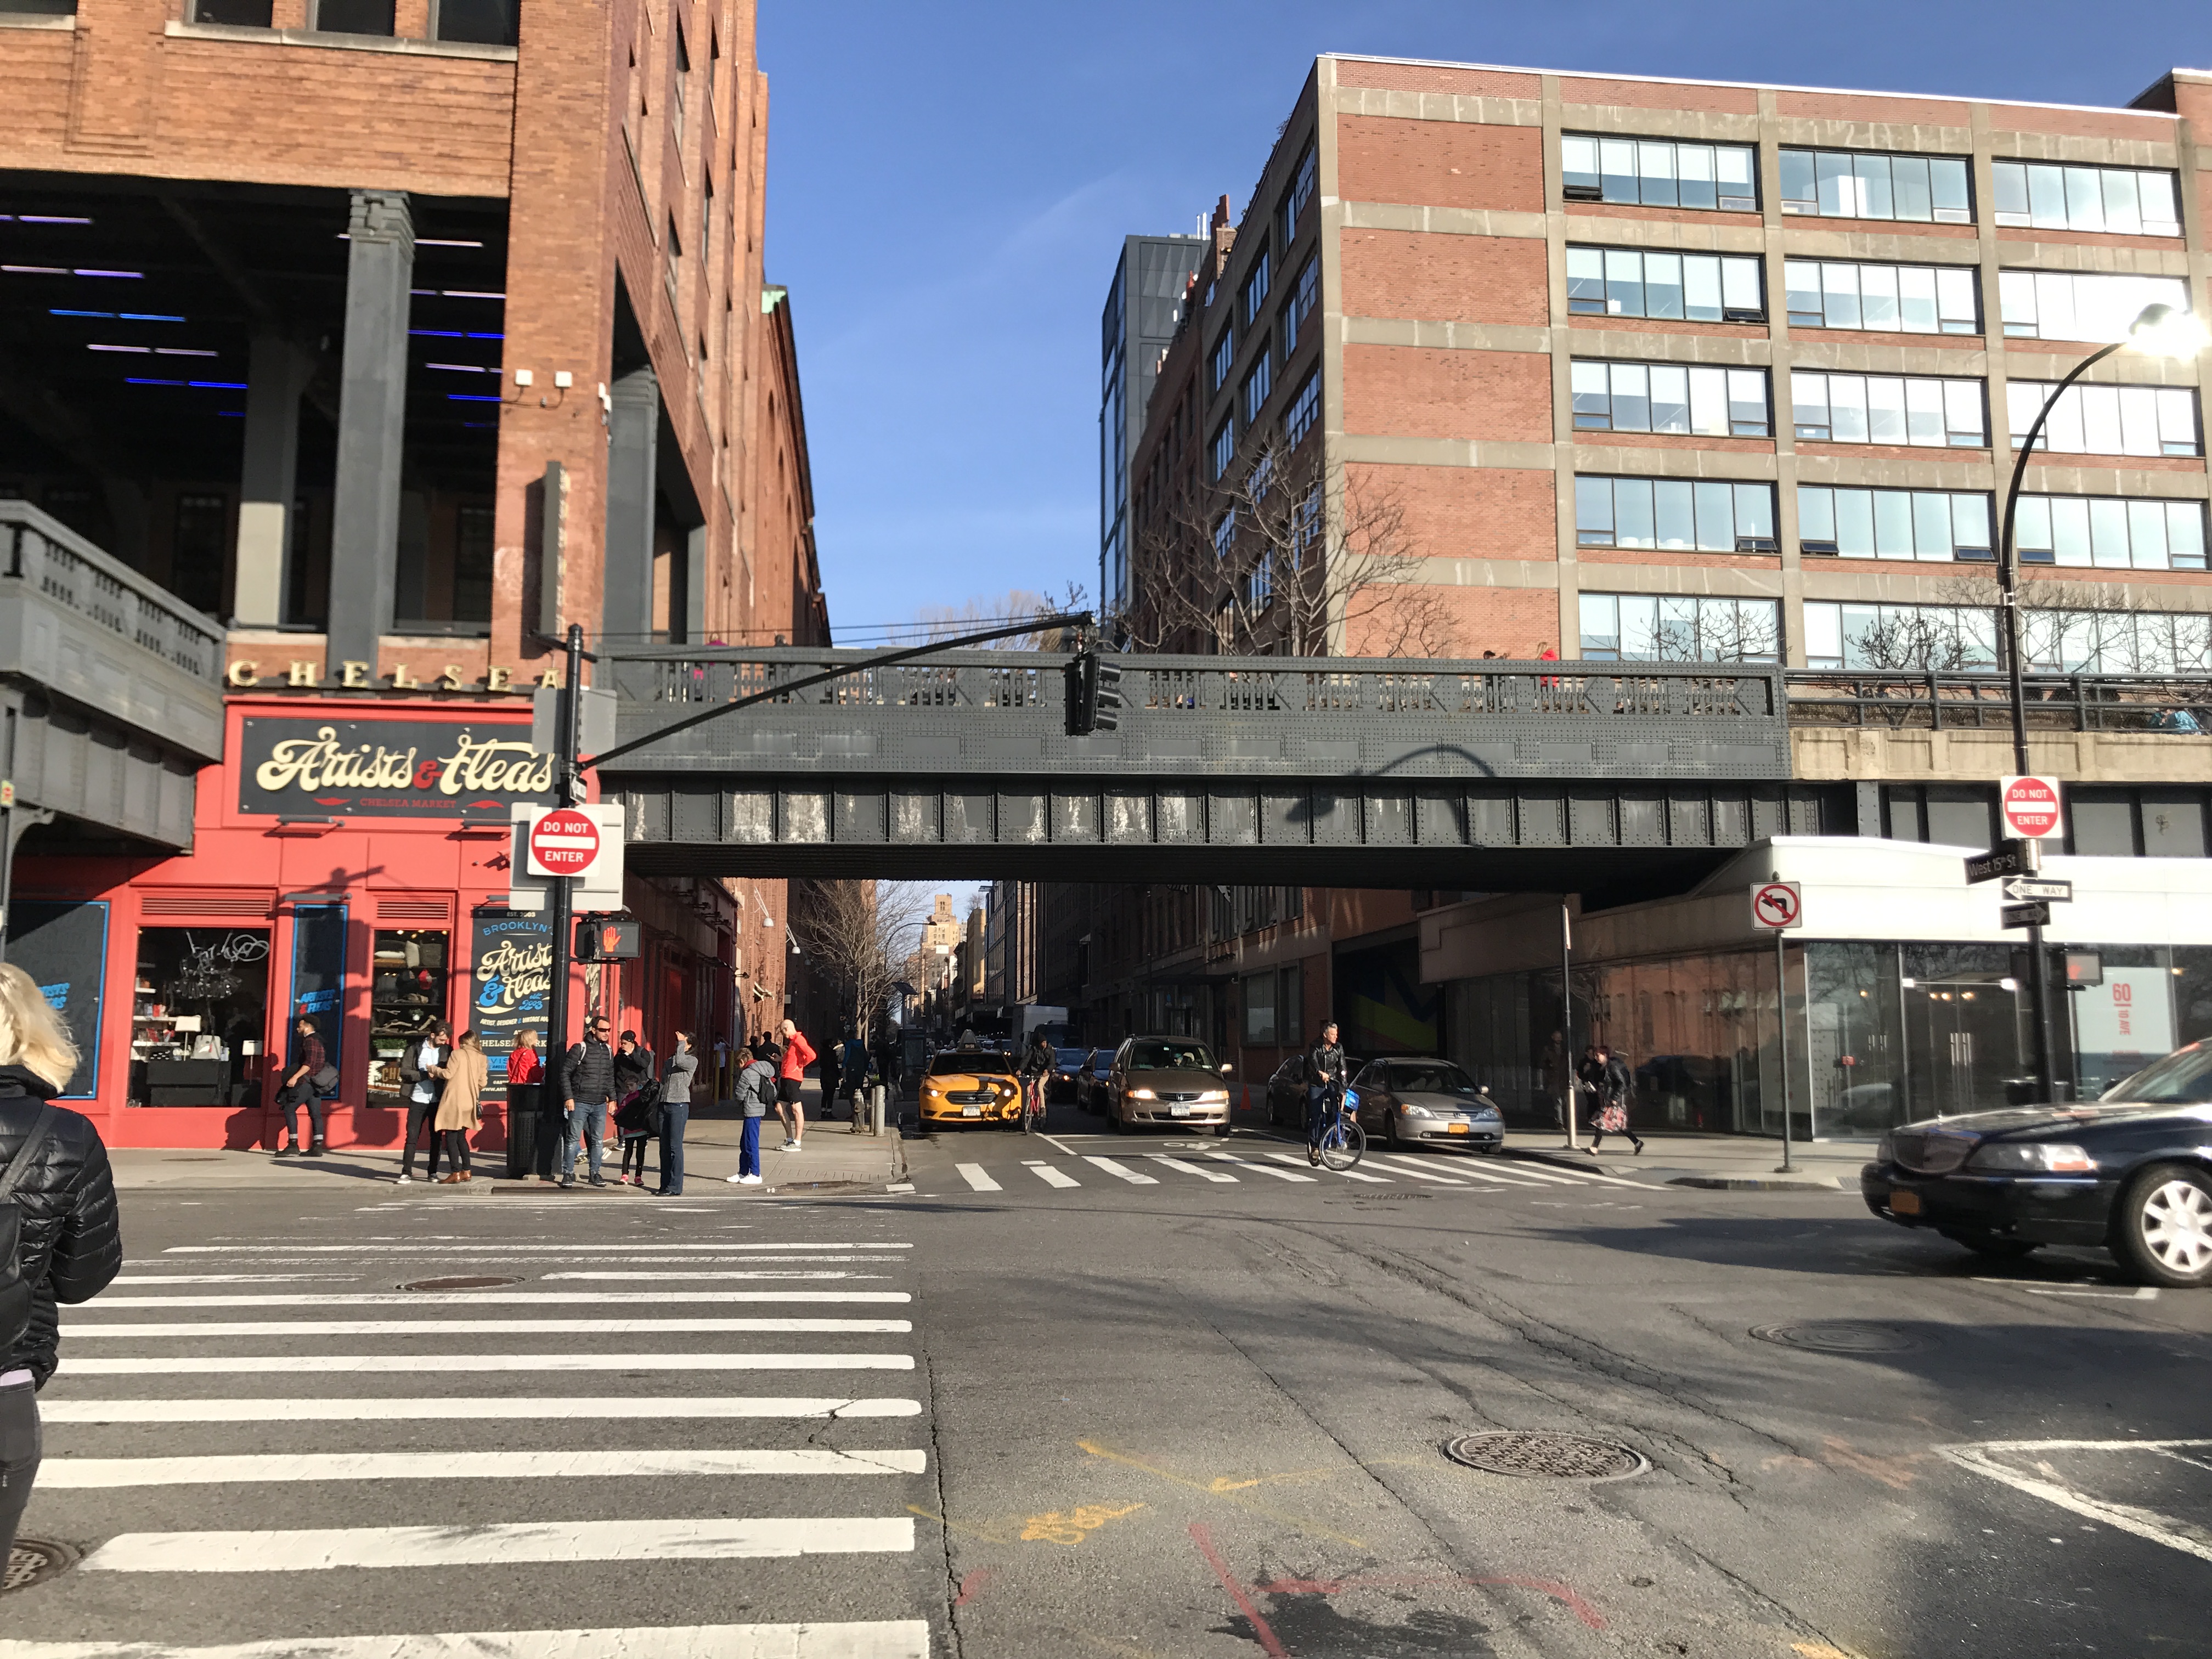
The first location I explored is the outside of Chelsea Market, which sits in a yellow zone (zone 3). While exploring this zone, I noticed three key features that can help lessen the damages caused by a potential hurricane. The first feature is how many of the windows and entry ways are elevated, which can potentially be helpful in preventing minor flooding. The second feature I noticed about this area is how many of the buildings incorporate roll up steel doors into their architectural designs for either garages or businesses. To some degree, I think the roll-up doors can have some potential benefits in terms of lessening the damages cause by a hurricane, and I can see how the areas along the coast can consider incorporating waterproof roll-up steel doors as a strategy in preventing buildings from being damaged in case of a hurricane. The reason why I find this strategy especially suitable for a place like Manhattan is because most restaurants and businesses on the ground level are made of large glass windows and doors, which make them especially vulnerable to wind and water. The third feature I noticed about this area is how this area’s buildings uses arguably much less glass and are much shorter than the buildings in Midtown and in Financial District, which make the buildings in this area both more stable and less vulnerable to wind compare to those built with glass.
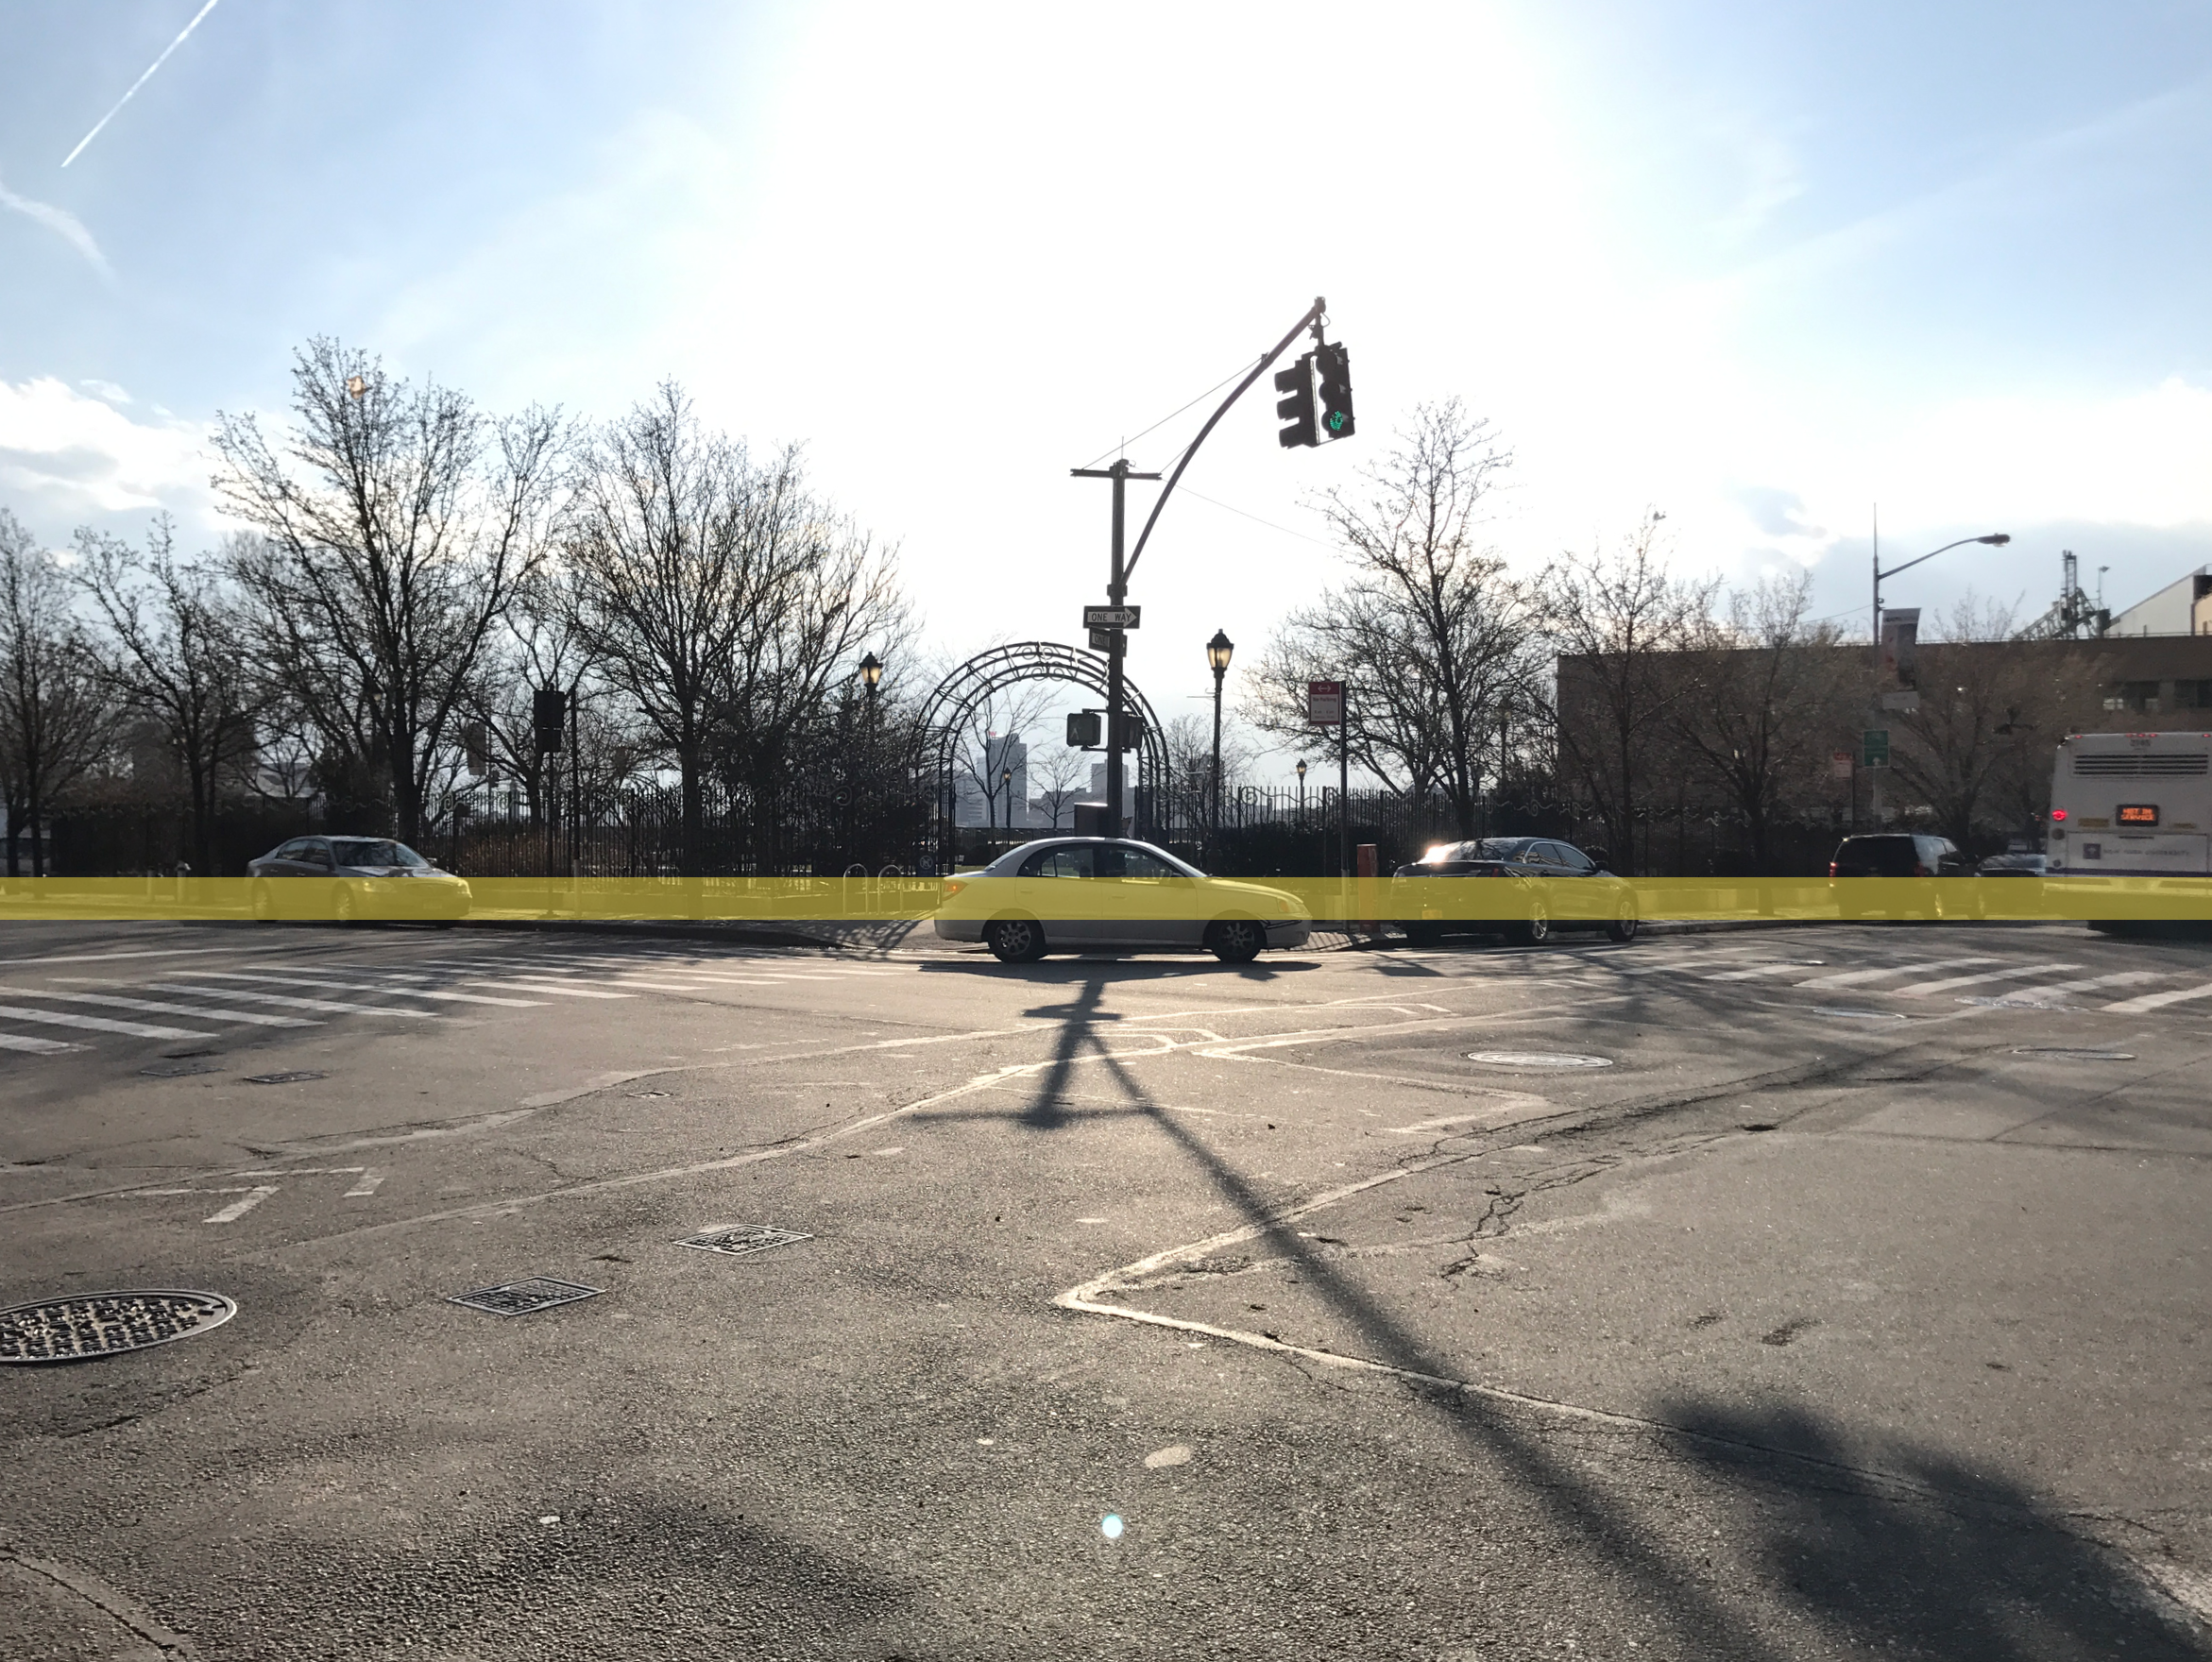
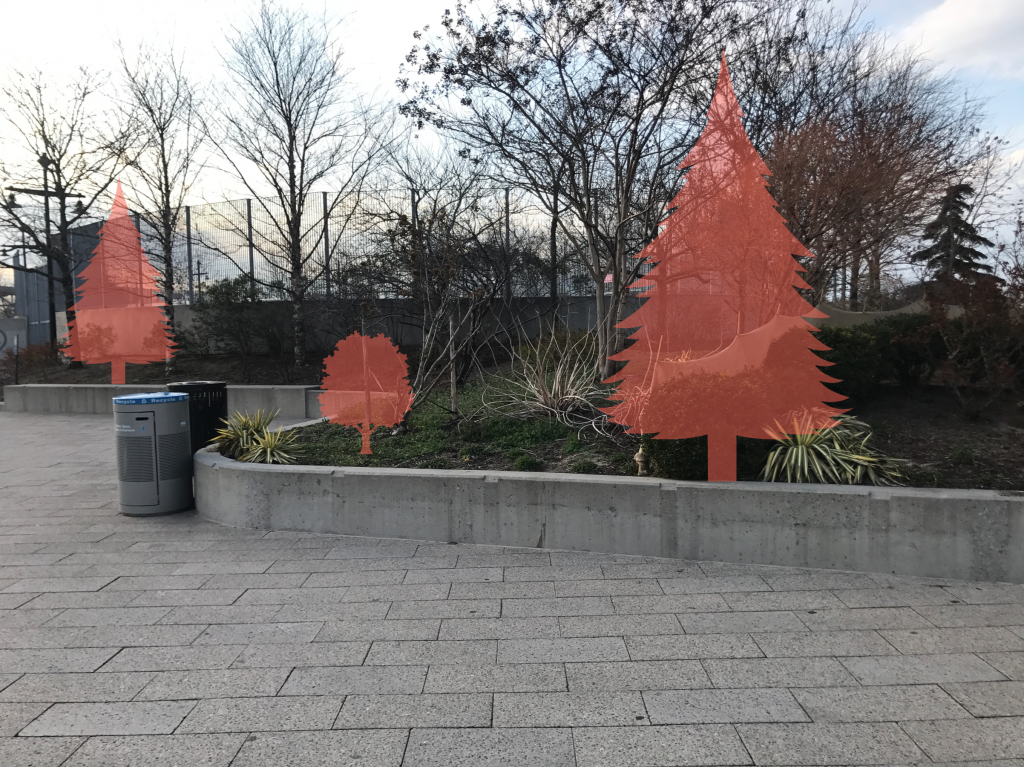
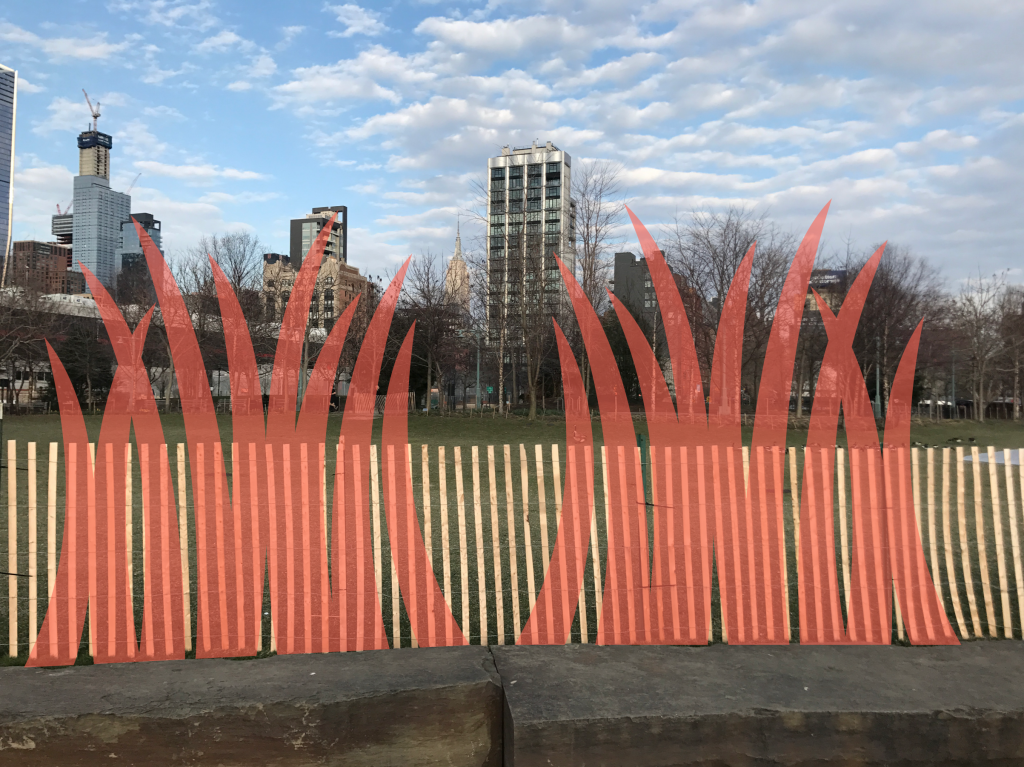
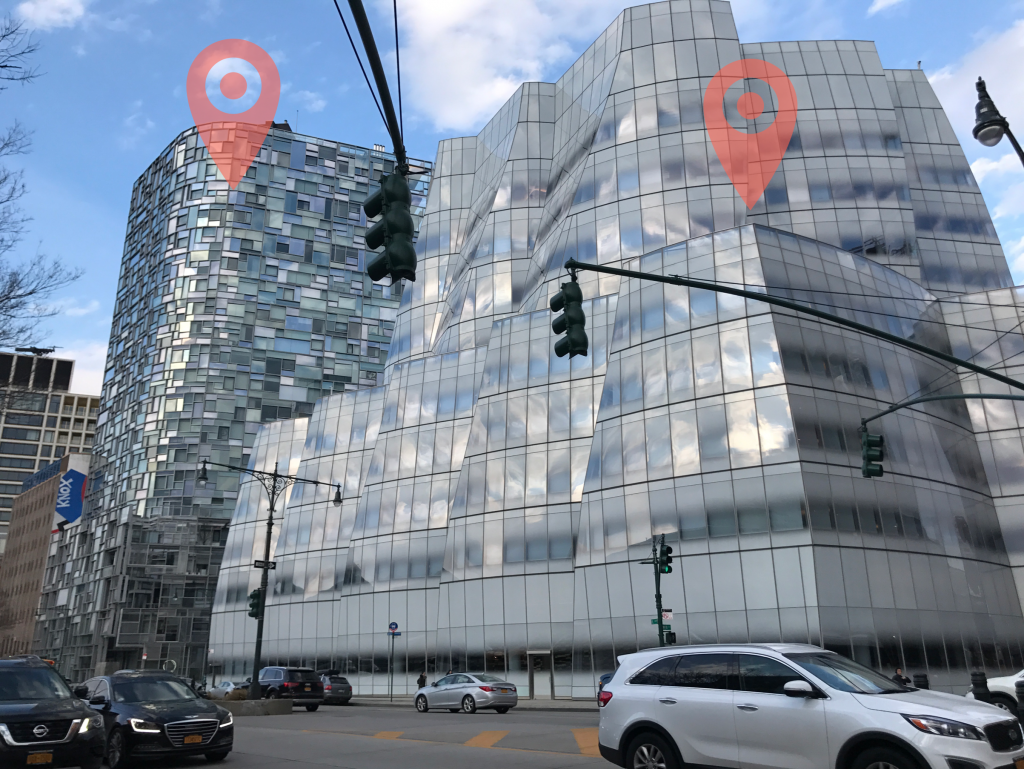
The second location I explored is the Pier 62 Skatepark and the green area surrounding it, which sits inside a red zone (zone 1). While exploring this zone, I focused on how hurricane prevention had been taken into consideration into the construction of this space. As a result, I do not think a lot of prevention measures went into it. First of all, the indoor area where the restaurants are inside the park is mostly made of glass, which makes it especially vulnerable to a potential hurricane. Overall, the design of the park as well as the roads surrounding it makes the area very flat and has little to no buildings tall or stable enough to guard the water against entering and destroying everything. Finally, I even noticed a few glass skyscrapers sitting very close to the Hudson River, which in my opinion absolutely disregarded the possibility of flooding. Altogether, I concluded that this area is not at all prepared. One positive feature I managed to find in the skatepark, however, is how a large area covered in grass inside the park can act as a water absorbing tool, although it will not benefit the situation by a lot. The trees inside the park can also potentially block the larger objects that may enter the city with water in case of a hurricane, although once again they will not help alleviate the situation by a lot considering how small and scattered they are.
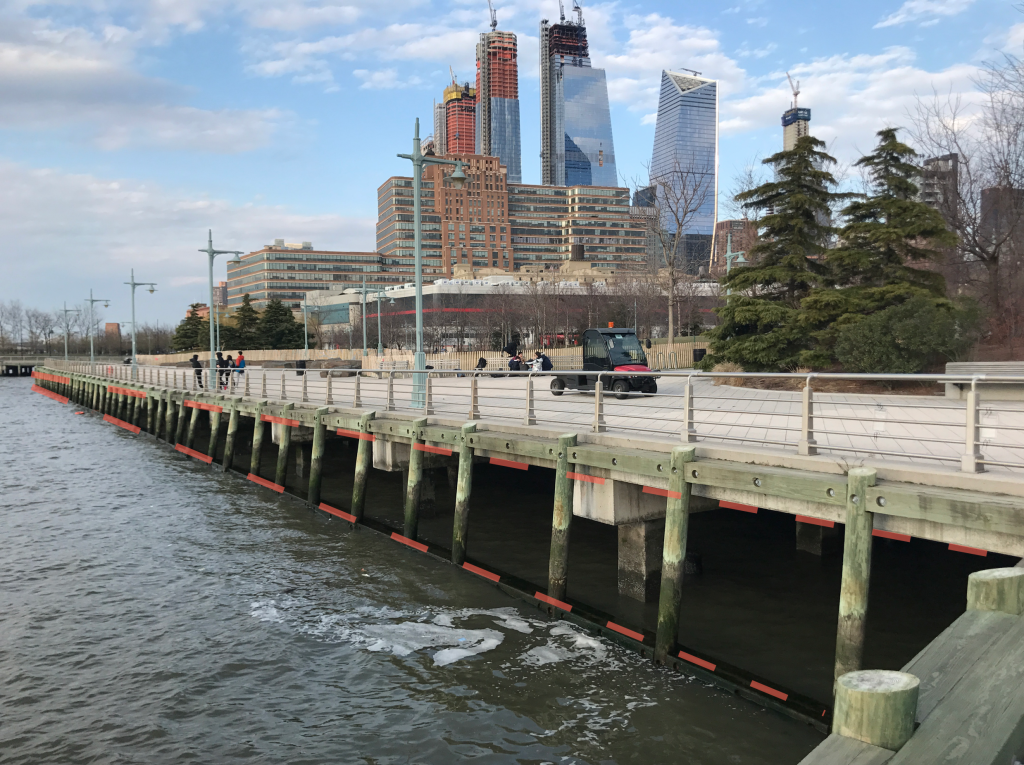
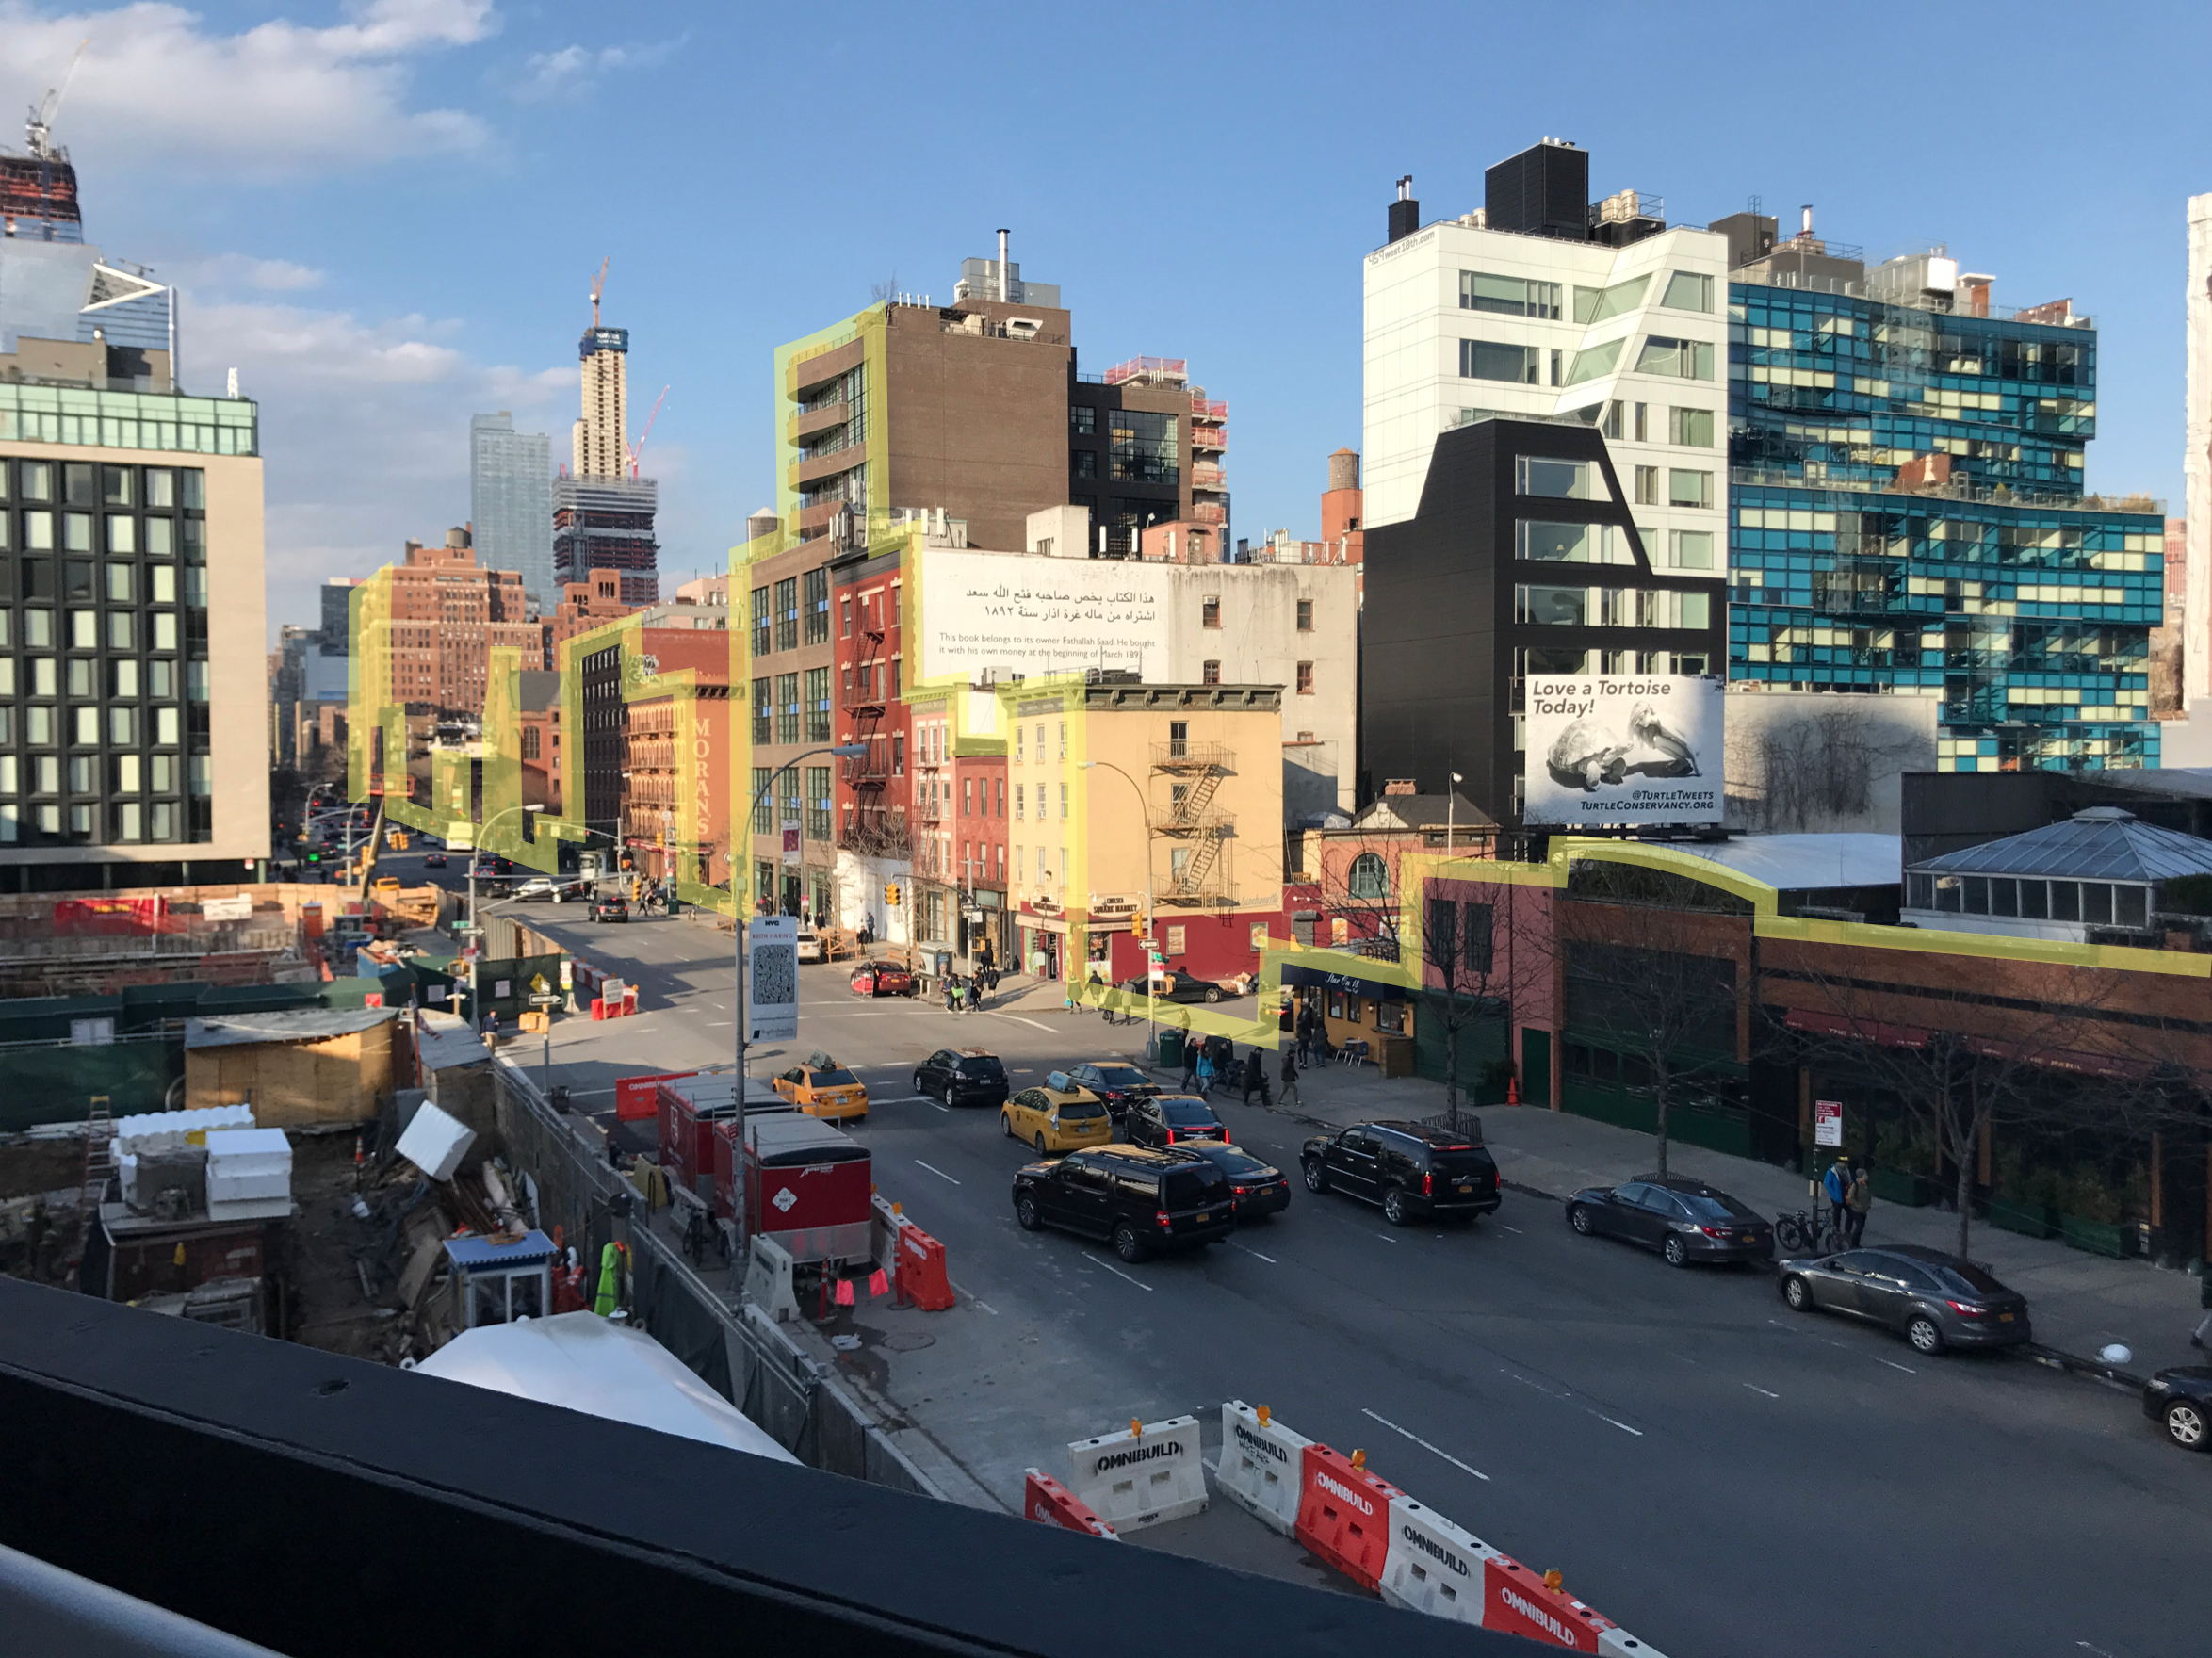
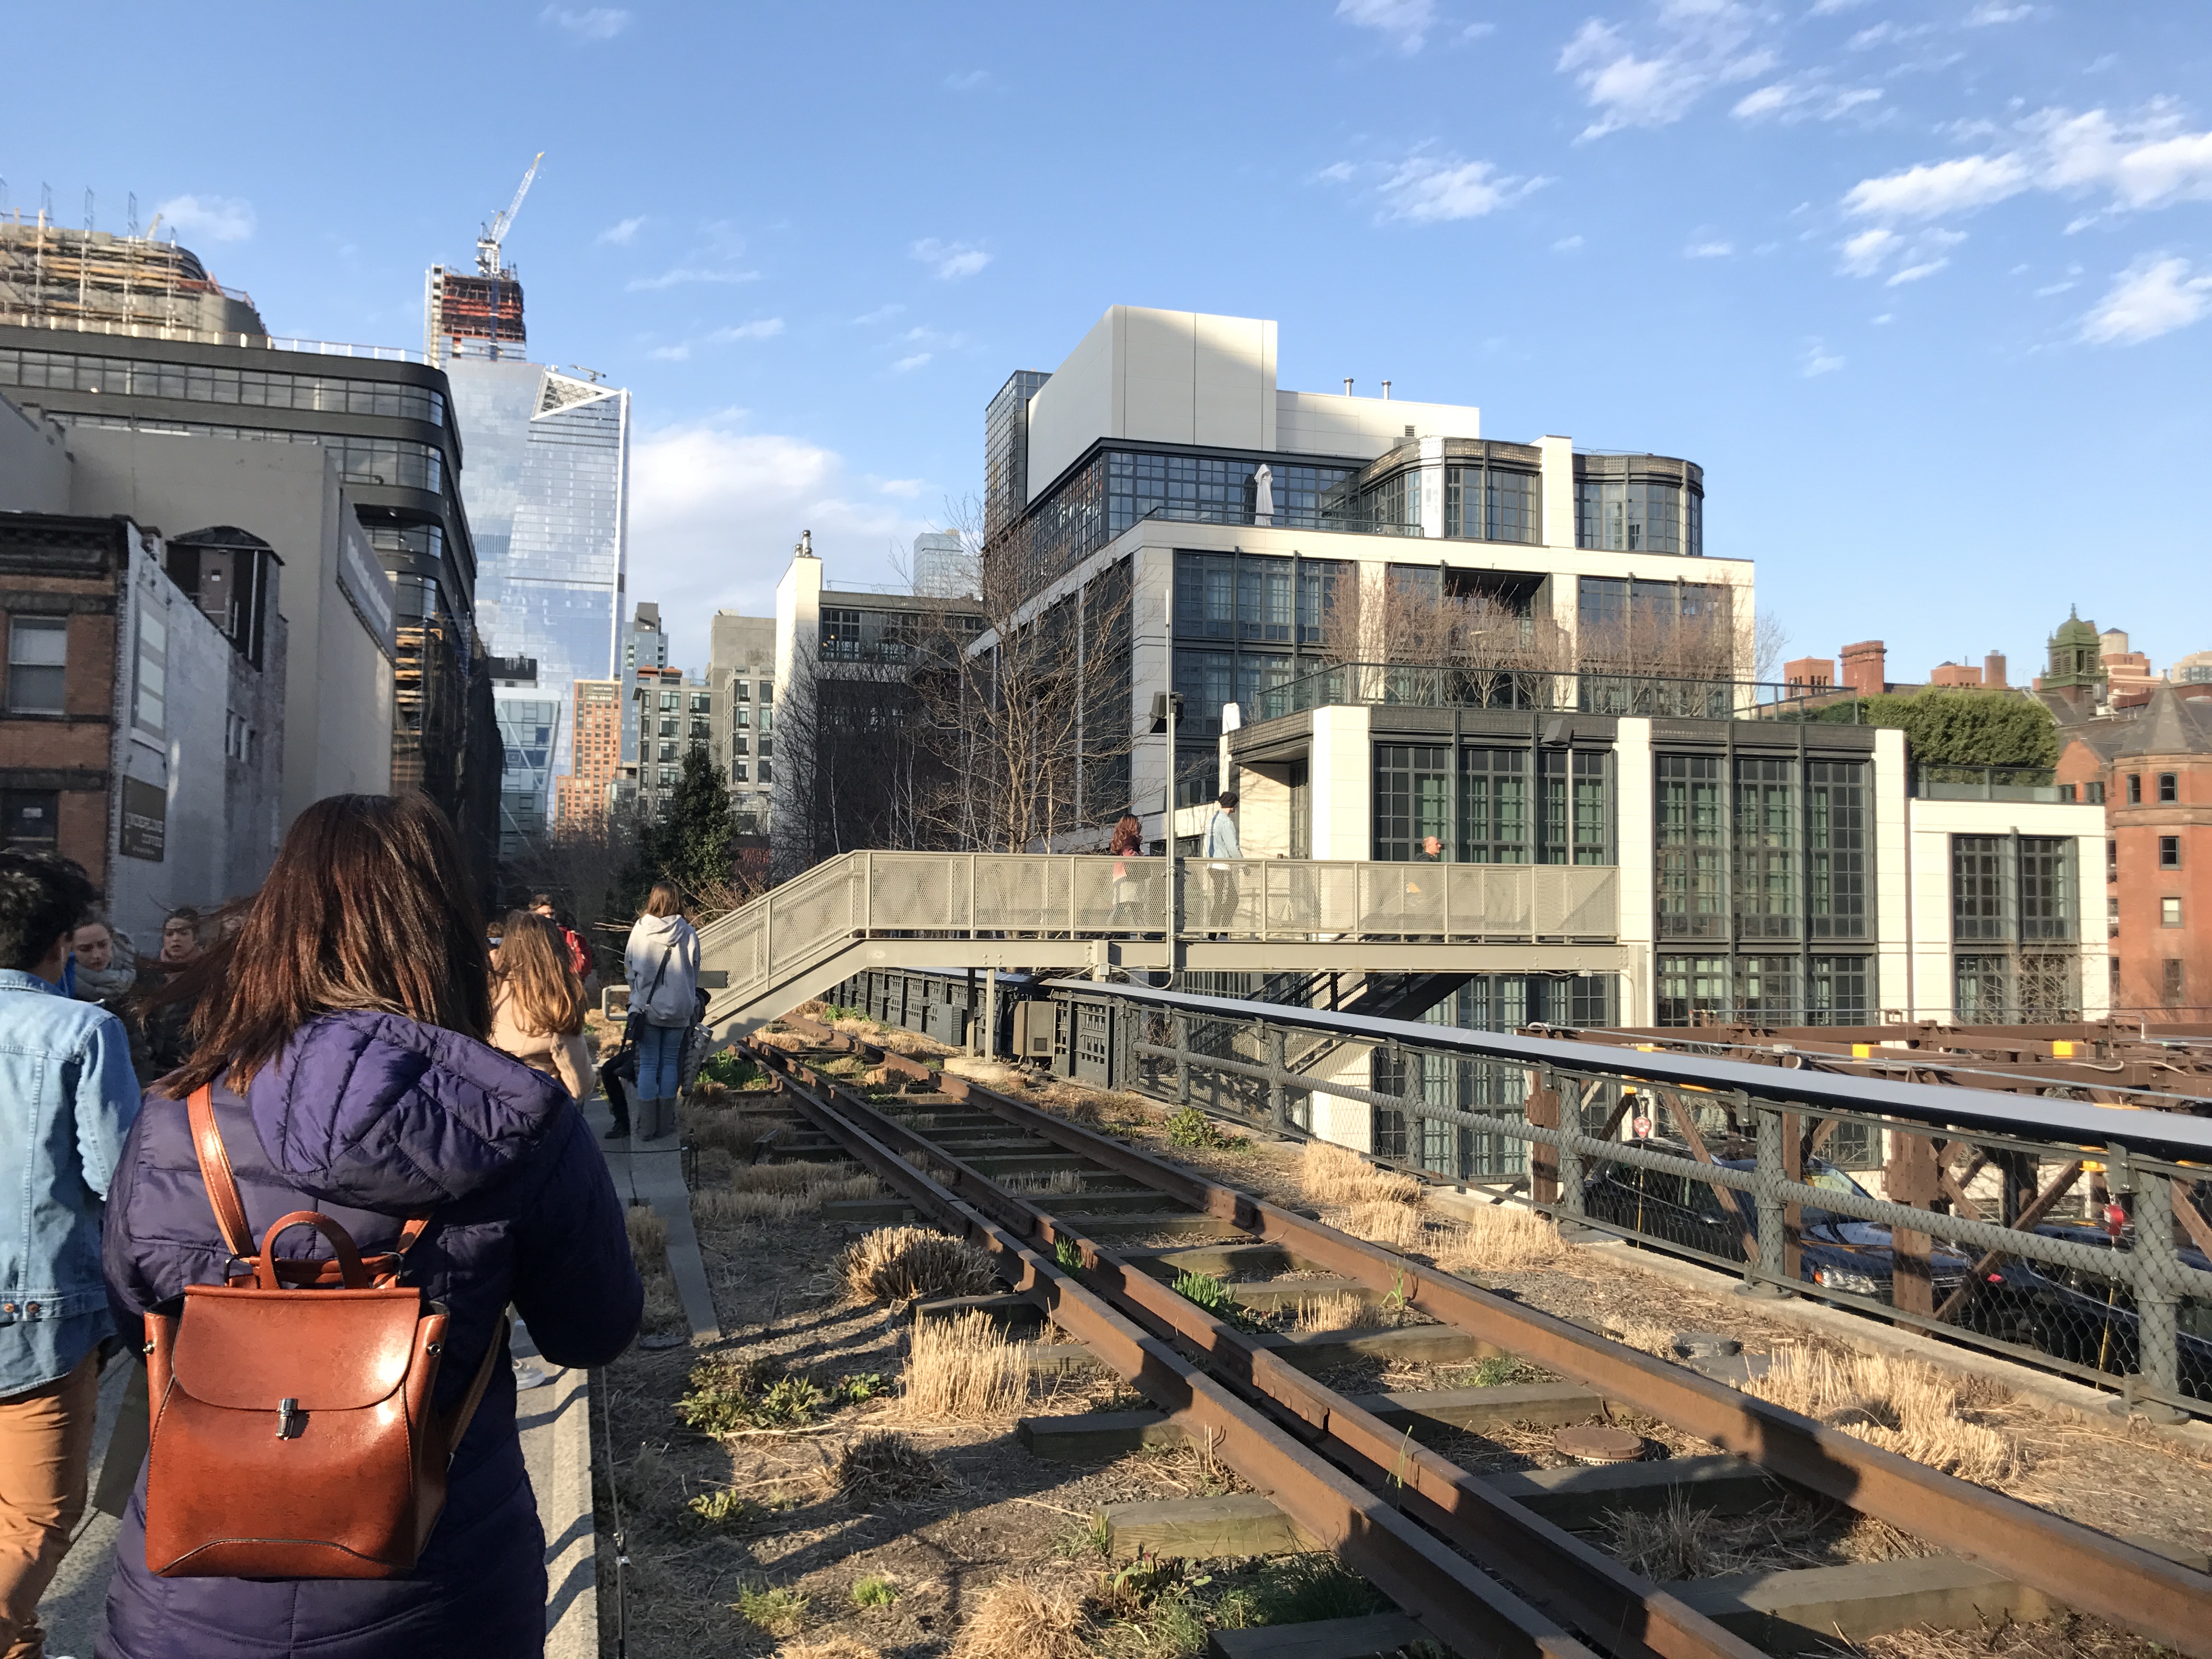
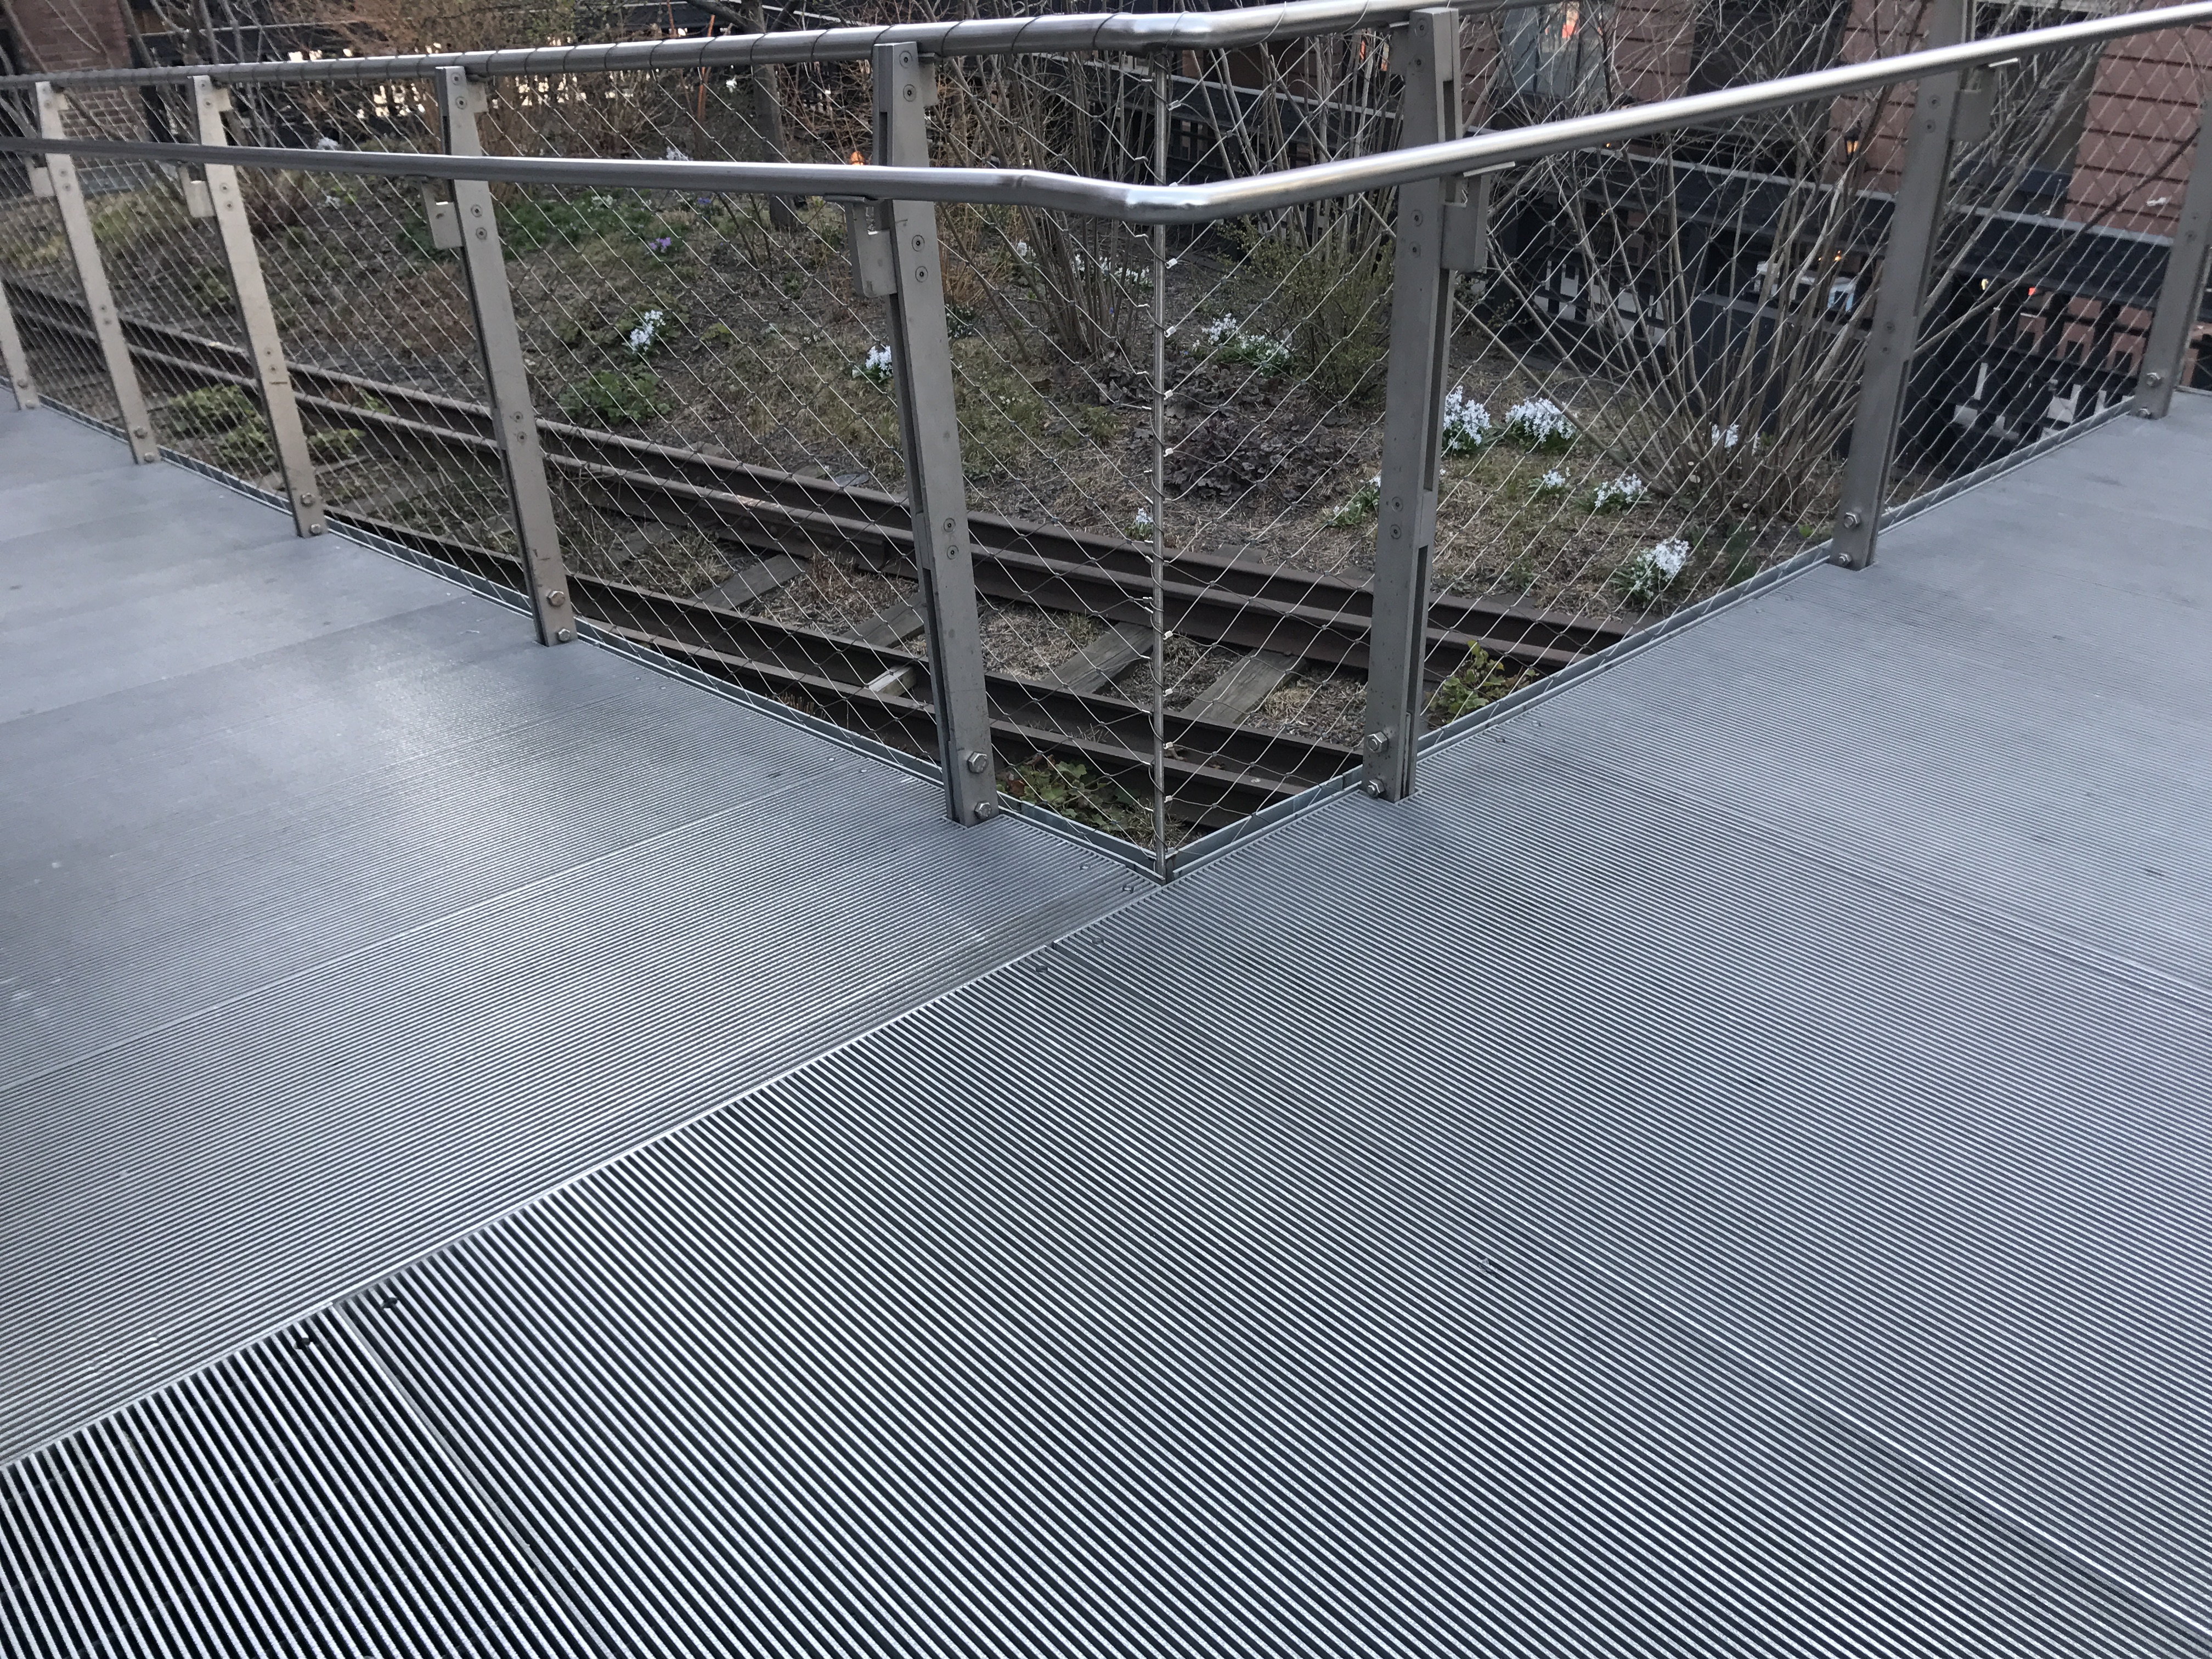
One extremely remarkable feature that runs across both of these areas would be The High Line, which is elevated and made of steel. In case of a hurricane, I can imagine how The High Line can be used as a way to travel from one location to another along the coast. Additionally, I also think The High Line can be used as a protective wall that helps prevent flooding East of the path from the 14th St to the 30th St. This can be done simply by installing sturdy roll-up steel doors underneath the path or by reinforcing other options that can quickly block one side from another to prevent further damage.
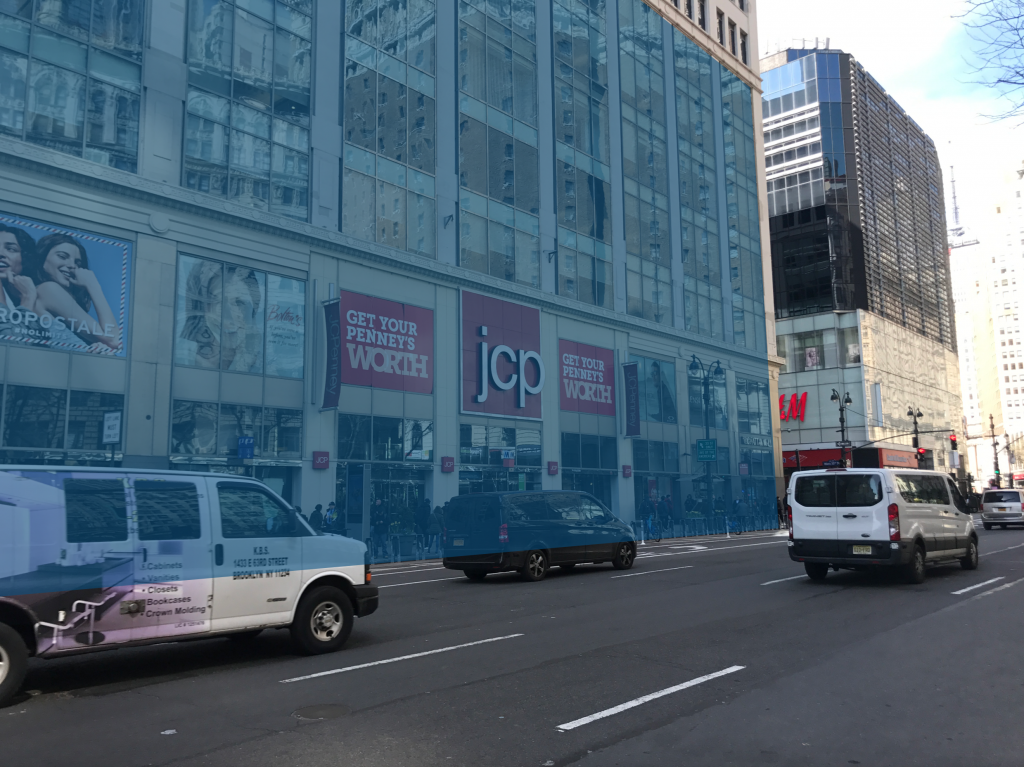
The third location I’ve explored is Korean Town and the areas surrounding it. This area is not color coded, making it the safest zone. Architecturally, I noticed how this location is so much different from the other two. Most if not buildings are very tall and many are made of glass. The population and vehicle density is also much higher. Subway exits and entrances are exposed and most activities are concentrated on the ground level. One potential benefit of this area is how large and tall these buildings are, therefore making them potentially more sturdy. Additionally, because these buildings have more floors, people affected on the lower level will be able to evacuate to higher levels for safety. Comparing this location with the other two, I do not find it any more vulnerable to the hurricane. I think the design of all three locations have their upsides and downsides, and therefore will have different prevention measures most suitable according to the differing characteristics. Living in this area, I do not feel any less threatened by a potential hurricane, because Manhattan as a whole is surrounded by water on all sides and I can never predict how high the water will be when flooding occurs. However, the fact that I live on the 8th floor does make me more relief that my shelter will most likely stay unaffected. Nonetheless, since most restaurants and grocery stores are located on the ground level, this can make acquiring resources very difficult if the city is flooded. In comparison to the two other zones, this is most similar to the zone which Parsons falls under. Interestingly, I find the architectural design of both locations to be very identical.
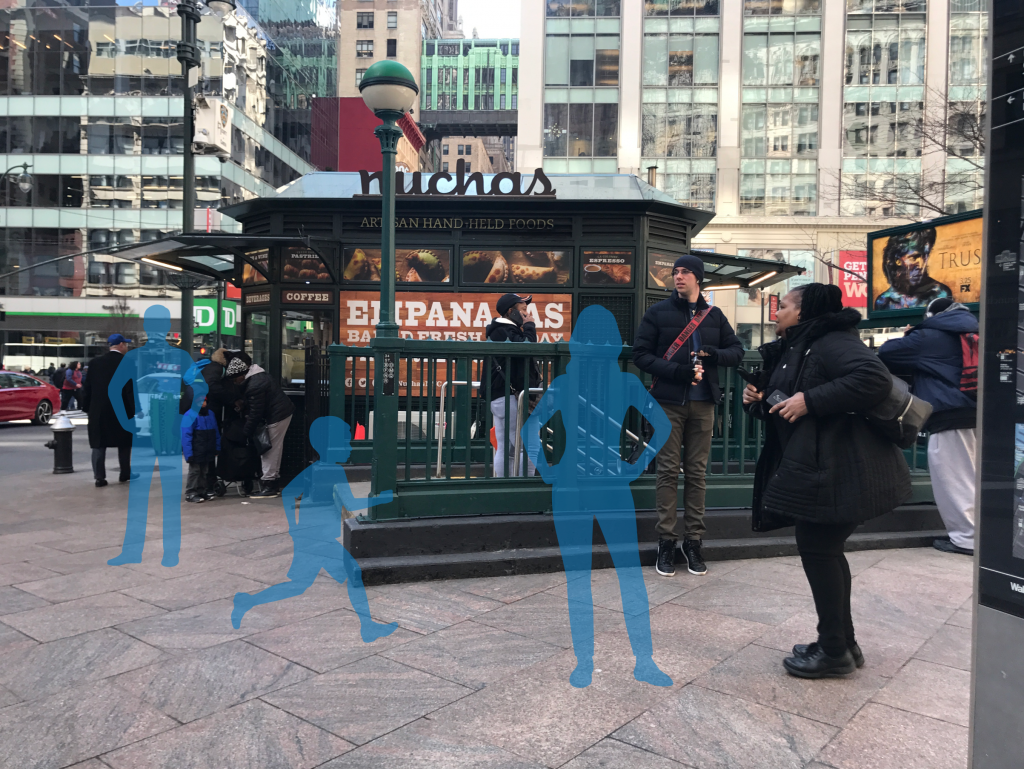
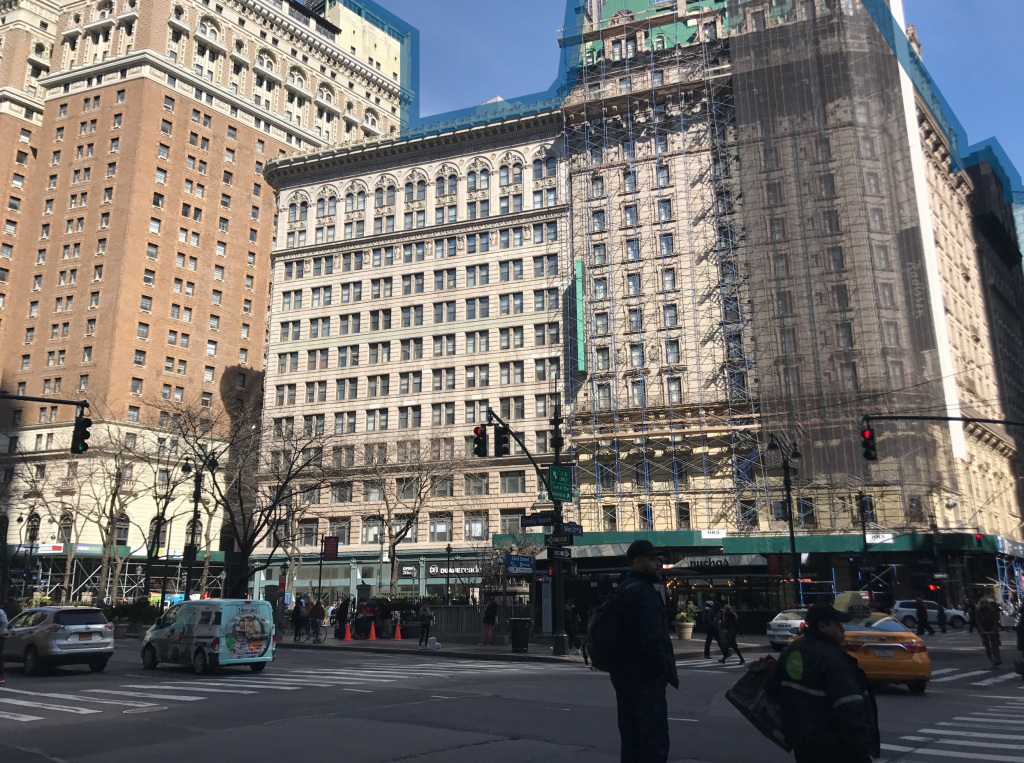
Having awareness about the evacuation zones while walking around the city makes me feel very vulnerable to any and all natural disasters that can potentially take place. Since New York City is designed neatly in cubes intersected by horizontal and vertical lines, I can imagine how tall buildings neighboring each other can fall down like dominos onto one another or how the roads in between a long line of tall skyscrapers can easily trap water, making the speed and pressure of flood accelerate as in passes through from one side to another. This experience made me realize how little humans can actually do when natural disasters are to take place. Since Pier 62 Skatepark is closest to water and does not appear to be very prepared, I would say this location is most vulnerable to storm surge. The most visible effect as a result of Hurricane Sandy would be the elevated entrances in West Chelsea, which I later on discovered was correlational to the hurricane. Finally, in terms of infrastructure, the safest place in Manhattan during a hurricane would probably be the Empire State Building, considering how tall and stable the building is and therefore good at withstanding wind and water.
Nowadays, most people have smartphones with connection to the internet. Therefore, I fail to see how physical implementation of these signs could be any more helpful or sustainable in comparison to those that could be implemented in the virtual world. One way of making people aware of what zone they live in can simply be developing a free app that tells people not just about evacuation zones but as well as the general sustainability and safety scores of the places or even buildings they inhabit in. This app should have constant updates about the newest information pertaining building structural changes and city designs and must adjust these scores accordingly. In addition, this app should contain voting and idea development forums where people who wish to participate can help change the environment they live in directly by voicing their opinions. The reason why I think an app containing that many functions is the only way to set forth real change is because if an app only addresses one issue that not many care about, the information will most likely be buried and go unnoticed, which is what happens to many other websites relating to the environment that I only got to know by taking this class.
An obstacle that comes with building this app would simply be the collection of all these data. The collection of these datas means having some understanding of each and every building and infrastructure in the city. This part alone would most likely take years unless many people work on this project together. The second obstacle that comes with building this app would be the constant updates and revisions that need to be done for information to stay up to date for its users. The third obstacle that comes with making this app would be the process of obtaining users, which can be especially difficult unless the product is marketed and pushed by other high profile sustainability and emergency management government institutions and NGOs.
(2) Object From Taiwan
The object I picked for this project would be TATUNG Rice Cooker, which has been in production since 1960. This object is something every single Taiwanese household know and the majority of households own. Many Taiwanese students that study abroad will bring one with them. I consider this object to be one of the most iconic objects ever produced and manufactured in Taiwan. The company TATUNG first partnered up with the Japanese company Toshiba to produce rice cookers in 1960. Together, they became the first to successfully commercialize rise cookers in Taiwan. A factor that makes TATUNG rise cooker different from that of other companies is its ability to turn off automatically when rice is cooked, making it a very intuitive household gadget. The fact that the rice cooker is so easy to use also helped save time and money for many people. Other than being a reliable tool for rice cooking, it can also be used to steam, simmer, and cook all kinds of vegetables and meat. The affordable yet reliable nature of the rice cooker made the product’s consumption and large-scale distribution possible. To people from countries that do not consume white rice as their main source of protein, this may be difficult to relate to, but to those that do, it is a product that can’t be used and simply forgotten.
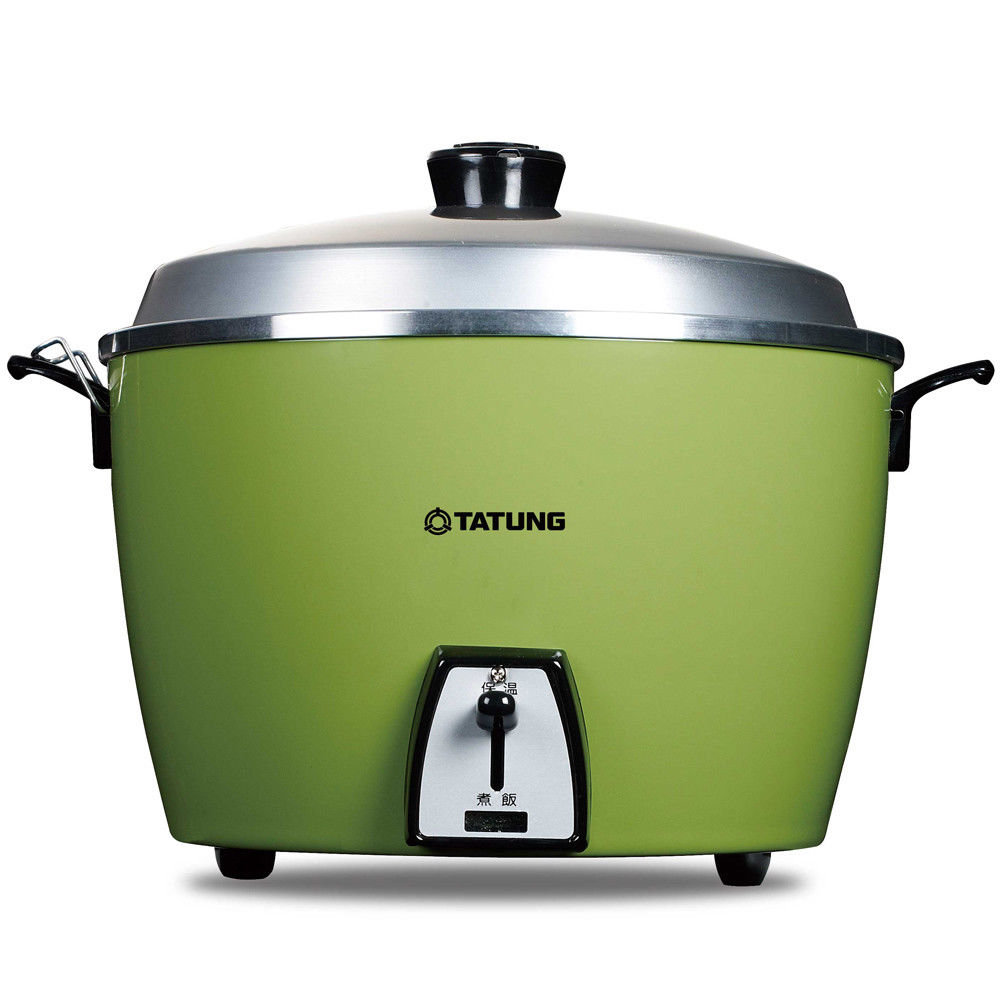

The reason why I think the product is able to withstand 50 years of competitions and obstacles is because of its reputation. This rice cooker is something that built its reputation overtime from household to household instead of something that rose to fame due to advertising. The affordability of the rice cooker not only make it accessible to most people but also make them feel like they are paying so little for something that is both reliable and serves many purposes. Lastly, the long history and popularity of the product also contribute to the product’s resiliency over time.
In my opinion, TATUNG rice cooker matches 6 of the 10 Long Life Design Criteria: (1) Repair, (2) Cost, (3) Sales, (5) Function, (6) Safety, and (7) Planned Production. In terms of repair, the rice cooker is so easy to fix that there are even Youtube Videos teaching people how to repair this product at home. Despite being a product that is so cheap, customers that have access to physical stores to TATUNG can even return these rice cookers to the company for them to examine and fix the rice cookers for free. In terms of cost, the price of a TATUNG rice cooker ranges from $55 to $135 depending on size and model, all of which are of course very reliable and can be used up to 10 years. In terms of sales, the company’s motto is frugality and diligence, which are both apparent in the design and pricing of TATUNG products. In terms of function, the product is not only very easy to use but also serves multiple functions. Many people who do not have access to stove will use TATUNG rice cooker to cook an entire meal. After a quick reach online, I did not find any injuries relating to the use of TATUNG rice cooker besides the potential hot steam that surges from opening the lid after steaming, which is something that occurs with all rice cookers. Finally, in terms of planned production, because there are only so many people in Taiwan and therefore so many famillies. The company can easily predict and control the number of rice cookers produced annually, making Planned Production a very easy criterion for TATUNG.
(3) NYC 2050 Research
Climate and Environmental Statistics
By 2050, the average temperature of New York City is expected to rise around 4.9 degrees Fahrenheit. New Yorkers will experience 22 days less of freezing cold temperature but 3 times as many heat waves. There will be twice as many plus-90-degree days and a 4 to 11 percent increase in annual rain precipitation. According to Ben Horton, an environmental change researcher from Rutgers University ” New York will either be reshaped by flooding or repeatedly brought to its knees by flooding.”
Population
By 2050, New York City will have about 24.8 million residents, making it the 9th largest city in the world in terms of population. In addition to the population increase, New York City will also have about 1.5 million residents who are 65 or older. The percentage of elderly will most likely continue to increase over time.
Legislation & Projects
By 2050, 80% of carbon dioxide emission is supposed to be reduced, limiting the increase in average temperature to 1.5 Celsius degrees. This plan proposed by the government in 2017 is also known as the 1.5C: Aligning New York City with the Paris Climate Agreement. Carbon Emission tax may or may not be implemented. The Big U will keep lower Manhattan relatively safe, whereas the public housings will most likely stay equally prone to the harmful effects of natural disasters as they did during Hurricane Sandy. User-friendly voting and polling applications will be set forth by the government. Building ratings may be implemented and buildings with the lowest rankings may receive funds to undergo renovation projects.
Infrastructure
Both vertical and rooftop farming will increase drastically in the city. Number of green infrastructures will also increase. All sewage and non-compostable organic waste will be able to be converted in to biogas, replacing the use of natural gas. Air filtering and selfhealing building surfaces will most likely be adopted into many architectural projects. Finally, all buildings and most cars will run on renewably generated electricity.
Citations
(1) archdaily.com: New York City in 2050
https://www.archdaily.com/455271/new-york-city-in-2050-twenty-seven-predictions
(2) VICE: New York in 2050 Will Be Wetter, Warmer, and More Dangerous
https://www.vice.com/en_us/article/qkkd9d/new-york-in-2050-will-be-wetter-warmer-and-more-dangerous