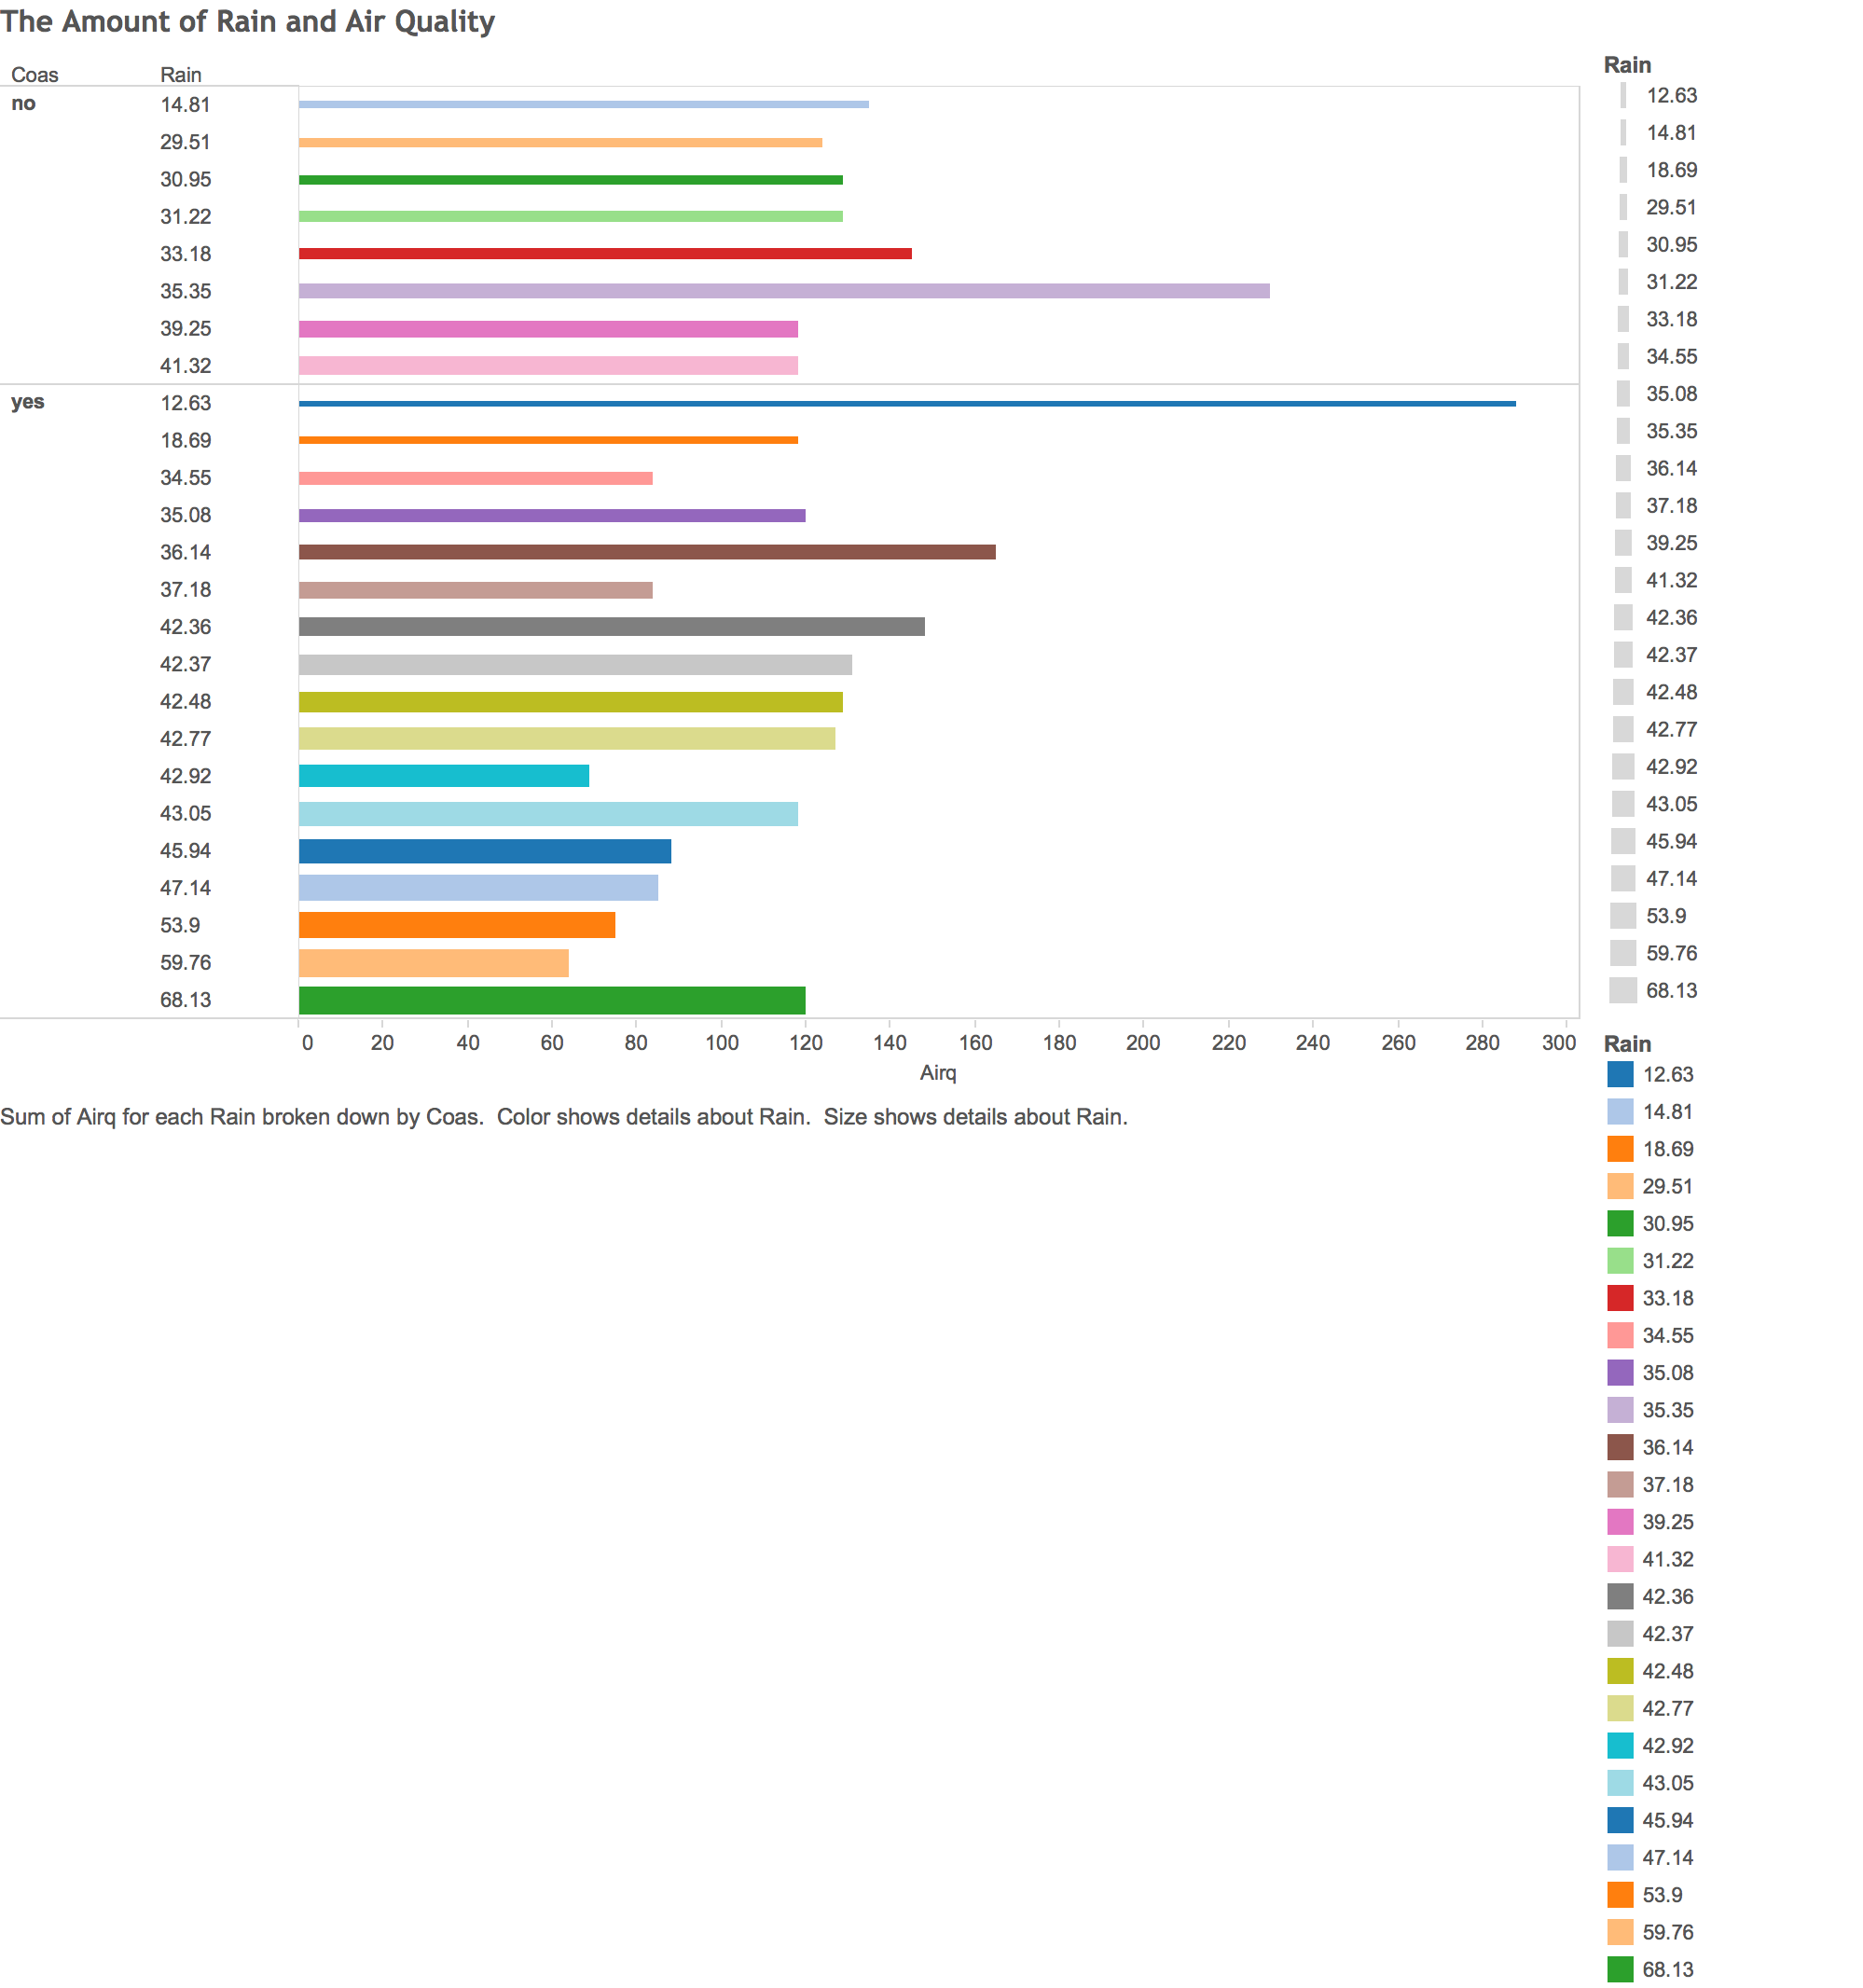
In the past week I have been working towards finalizing my idea for my final project. I started with the idea of having food being the answer to the question “what is the key to life” and then branching out into various areas of food and how food can tie into world hunger. Finding good data sets that actually support this idea was actually extremely hard and I did not find any that I believe were strong enough to make for good data sets so I thought to change my idea again. I am approaching this question in a logic sense, “what is the key to life?” initially I knew food is what keeps us alive, but so does air. We eat and breathe to stay alive so I decided to maybe focus on air quality. I found a data set that specifically focused on the air quality of Los Angeles, my hometown so I felt a connection with the material, however the data is from 1972. I am going to continue to look of more data to either support this idea of my food idea but this is a visualization of the info from the air quality data set. The chart shows the air quality of regional locations that were either in a coastal area or not, and also shows the amount of rain in inches that those areas received. The lower the number for air quality the better. From this set specifically I can see how the coastal areas that were observed for this had better air quality than the locations that were not near the coast, and they also received more rain.