“In 2002, buildings were responsible for 7.85 Gt, or 33 percent of all energy-related CO2 emissions worldwide and these emissions are expected to grow to 11 Gt (B2 scenario) or 15.6 Gt (A1B scenario) by 2030 (IPCC, 2007).” (page 90)
For me, this quote from the text sets up the whole reading. A large portion of the reading was related to climate change and how emissions can be reduced and the impacts can be mitigated. I thought this was a very informative and positive outlook because so often the problem is shoved in our face without a possible solution.

I found it very interesting when on page 96, the reading talked about power plants located along bodies of water. It spoke about the impacts of past hurricanes on these plants which I found very interesting. These power plants are very vulnerable to not only the rain and winds that come with hurricanes, but also storm surges. This reminded me of our Circle Line field trip because someone spoke about storm surges along that very river. They spoke about areas impacted from Hurricane Sandy and what is being done now to prevent those impacts in the future. For example, there are now more barriers along the water to at least slow the surges down and hopefully keep at least some of the water in the river.

This diagram, found on page 103, shows how the emission impacts were projected to decrease based on the London Climate Change Action Plan. This is an example of one city that is actively trying to mitigate the impacts of emissions. The reading even exemplifies five possible roles the government can take on that are also suggested by Energie-Cités and Hammer. These roles include; rule making, regulatory oversight, direct expenditures/procurement, financial incentives and information/advocacy. These policy and role recommendations are important for governments to think about because the emissions are not going to fix themselves no matter how much we wish they could.
The other aspect that was brought up on page 107 was knowledge gaps. I think this is very important to point out because everyone is still learning about the topic and it helps the reader realize that this issue is much bigger than even the smartest people can currently understand.
I also found the concept of human health in relation to climate change very interesting. Often I subconsciously think of climate change as only impacting the earth but it impacts the earth’s inhabitants as well. Extreme heat in Paris, monsoon floods in Mumbai, intense rainfall and high-tide in Dhaka and hurricane Katrina are all examples of climate change influenced events that cost over 1000 lives. (Page 181)
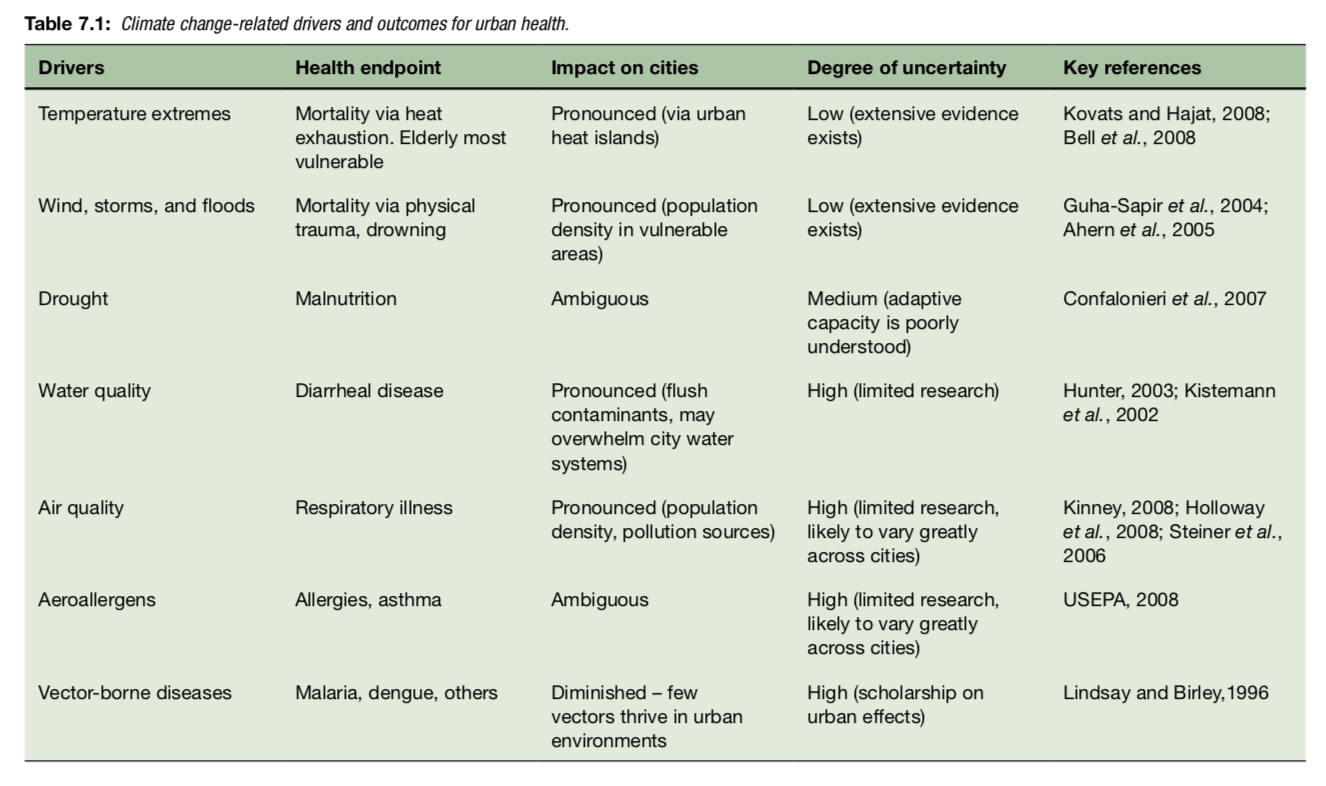
This table was on page 184 of the reading and shows the “climate change-related drivers and outcomes for urban health.” I found this table very helpful in contextualizing what was being said.
I also loved seeing graphs and information about Toronto at the end of the reading because it was helpful to contextualize everything with where I grew up!