Assignment
Over the last two weeks you were collecting qualitative and quantitative data—either by ethnographic observation and recording, mapping, or by reading and commenting on the statistics. You also became more familiar with the neighborhood that you are researching, having visited it at least three times by now. The texts you read provided diverse approaches to gathering and organizing information: different ethnographic methods, observation and interpretation of interactions in city environments, drawing the relation between meaning and objects, analyses of physical traces, and mapping and data visualizations—all these expanded your vocabulary of methods and phenomena observed.
In your Bridge 2, you will explore the relations between the quantitative and the qualitative in the explorations of constructed environments. Organizing data should also help you with formulating your research questions that will drive
your individual projects.
Process
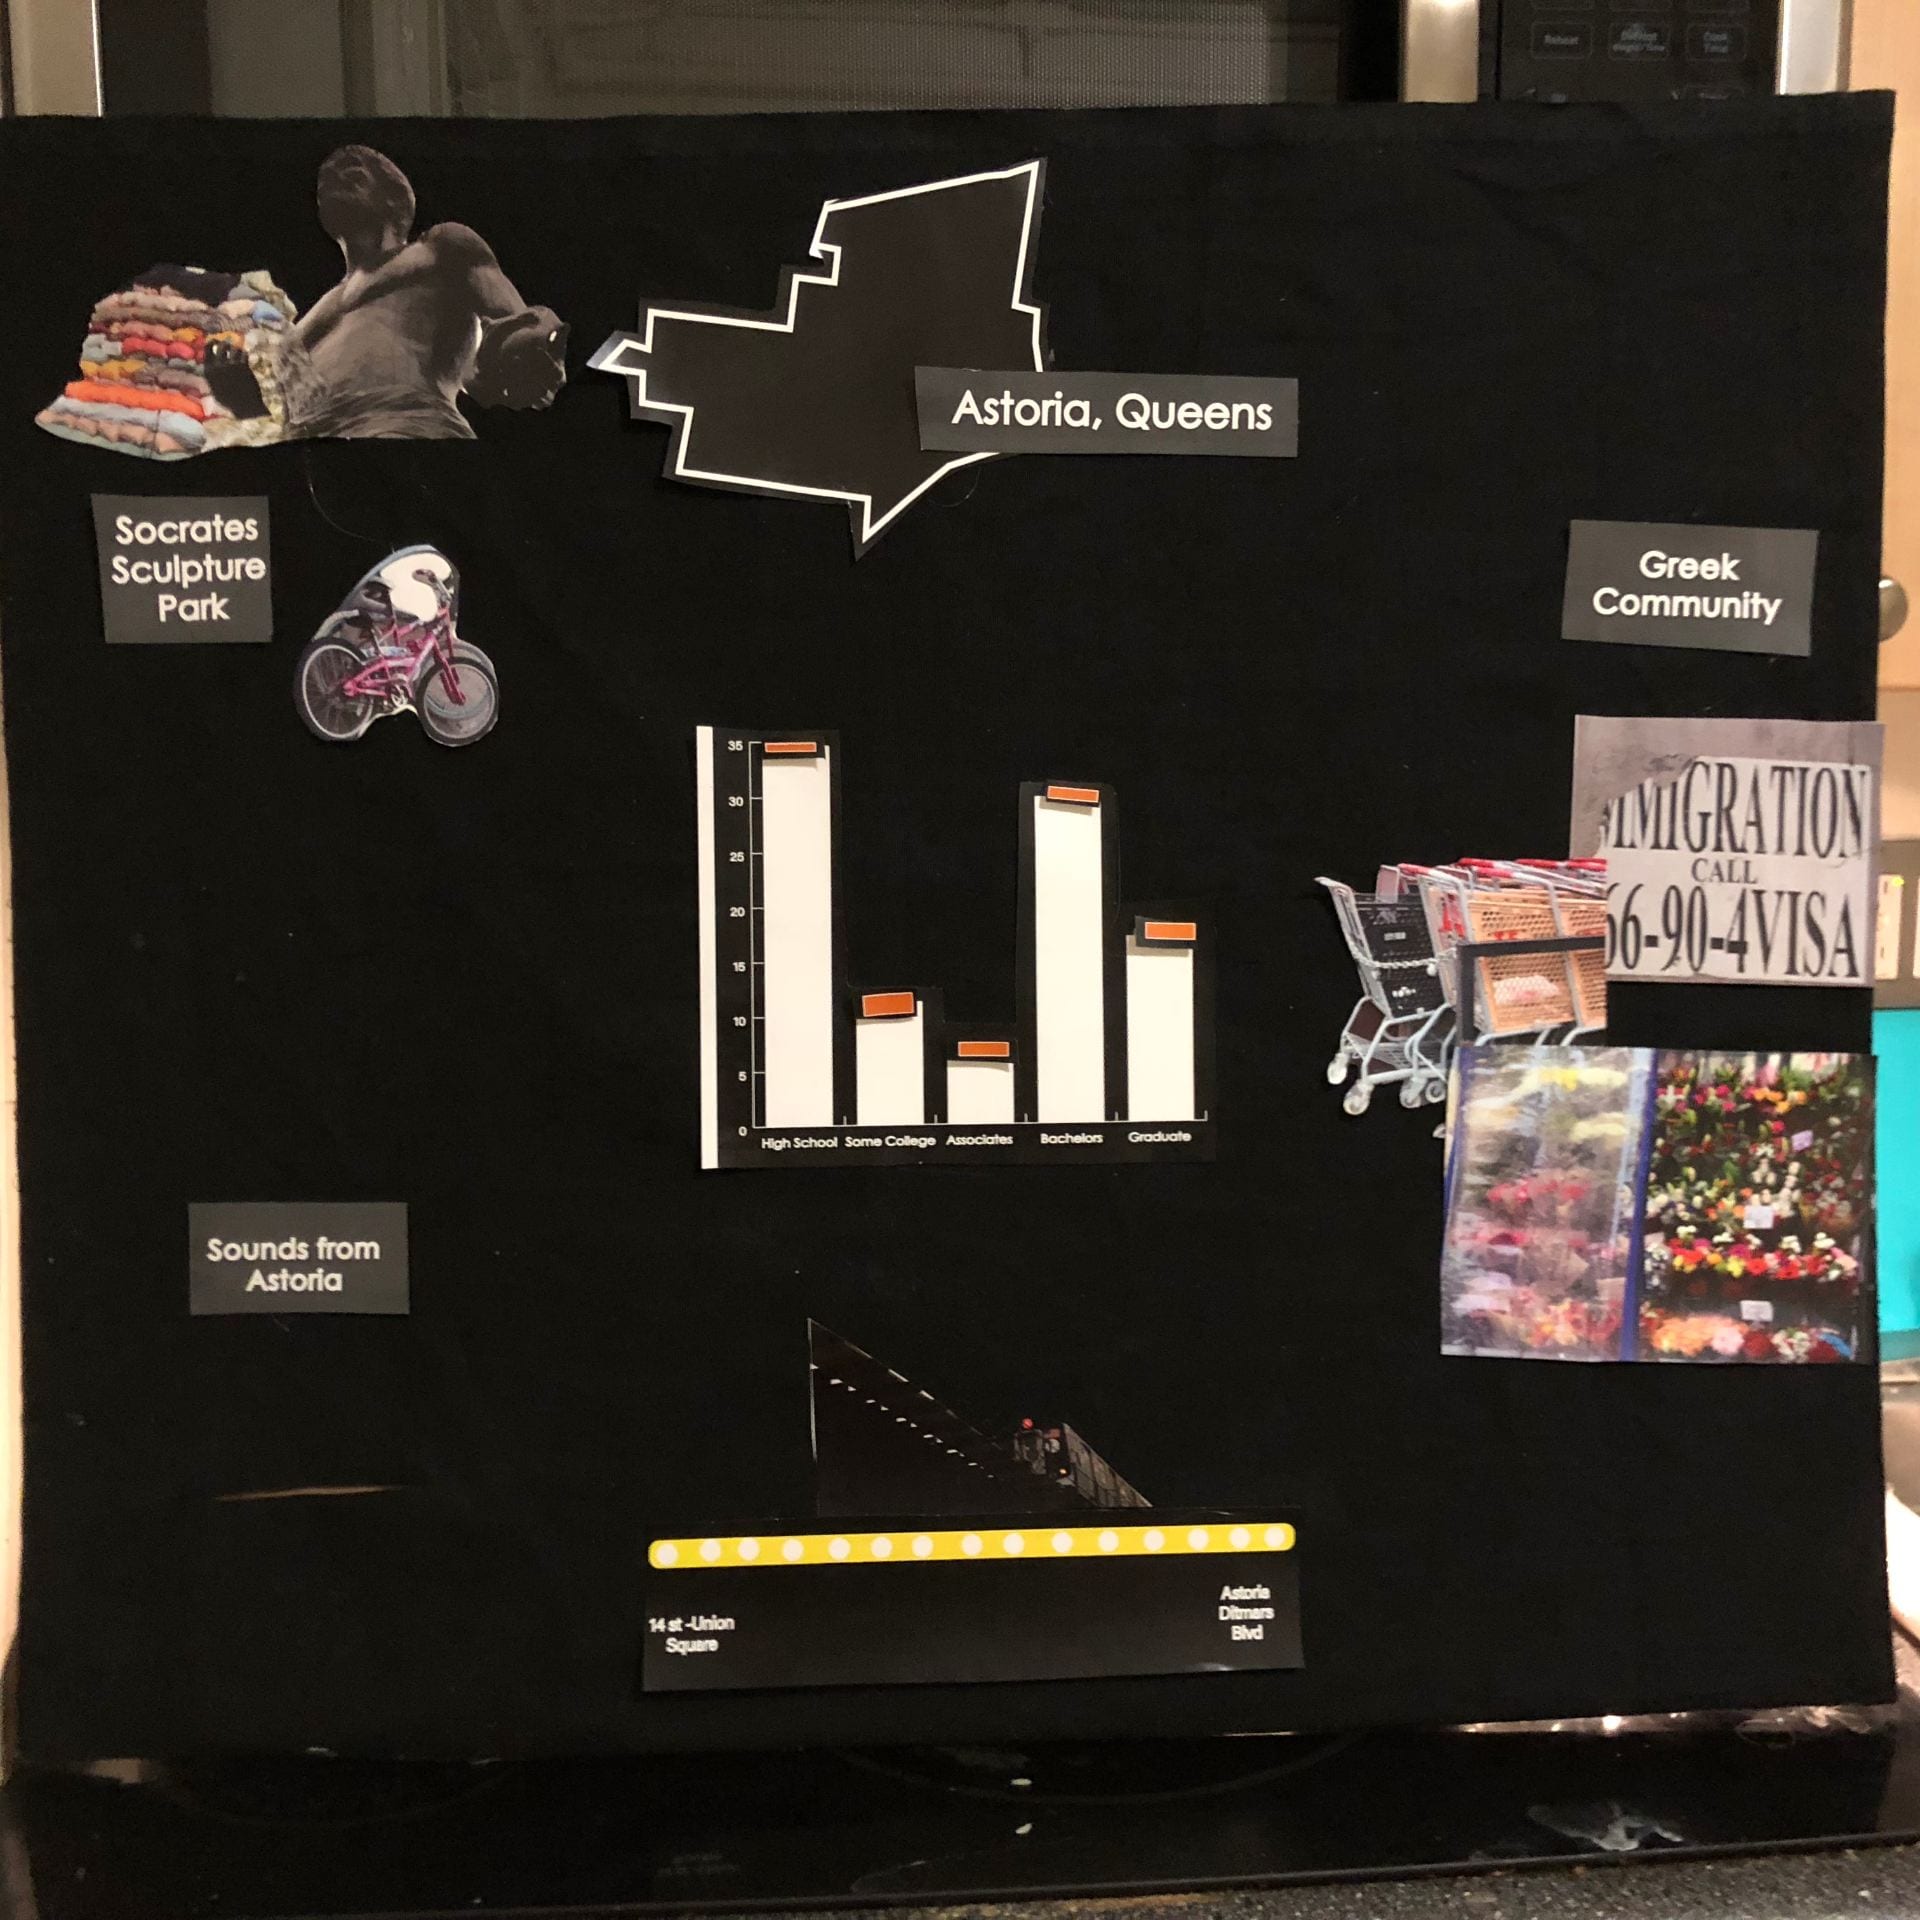
I visited Astoria twice and took notes, recordings etc before I began to assemble this presentation. I decided that I would once again use fabric but this time I would transfer photos onto the fabric directly. Here was my attempt.
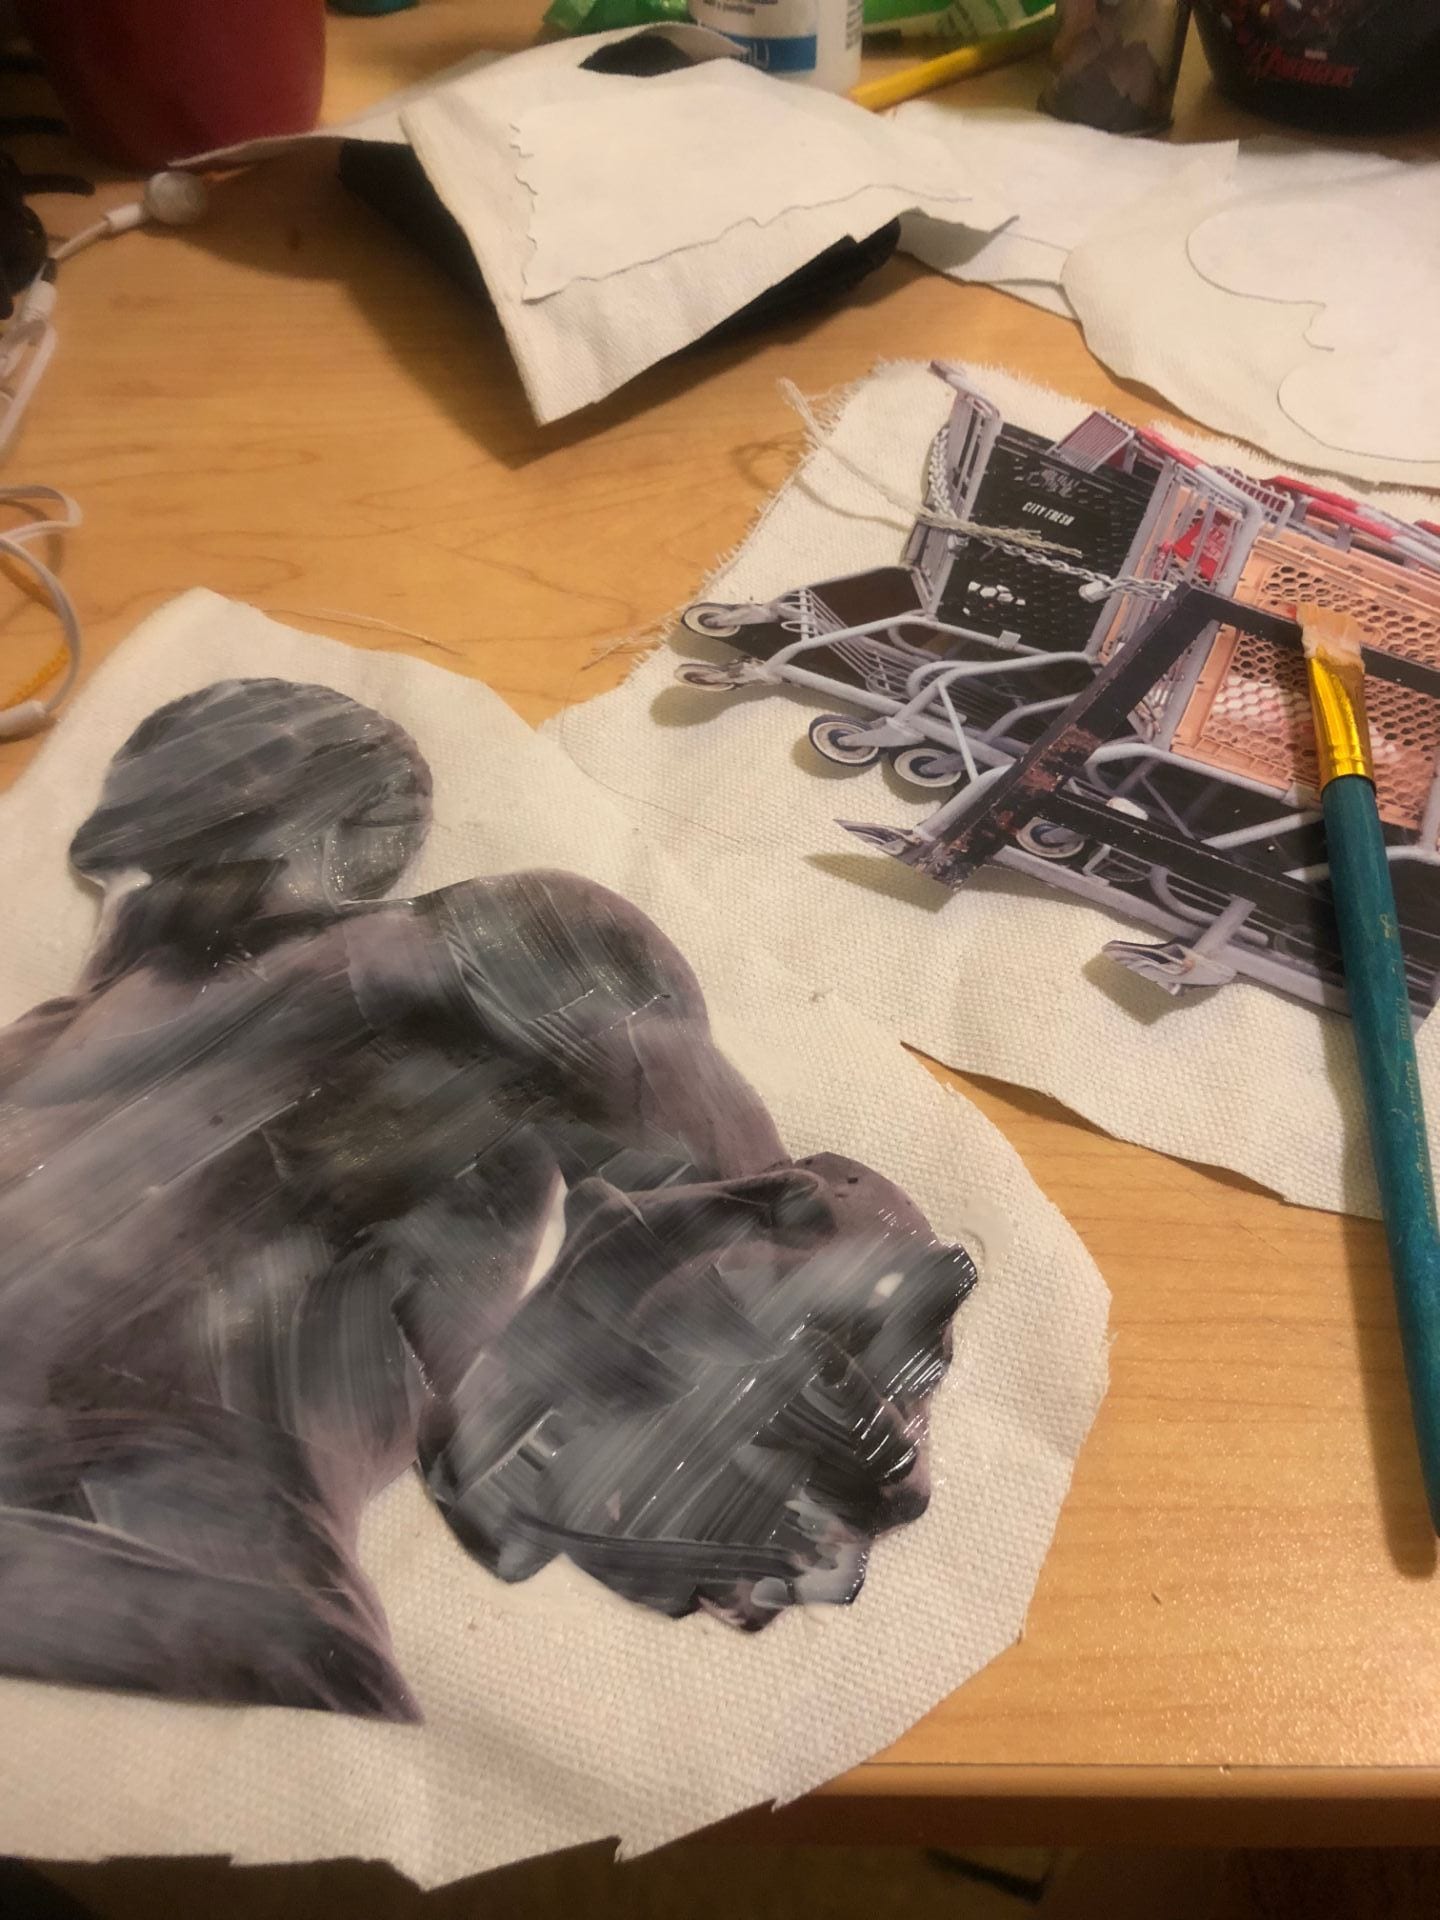
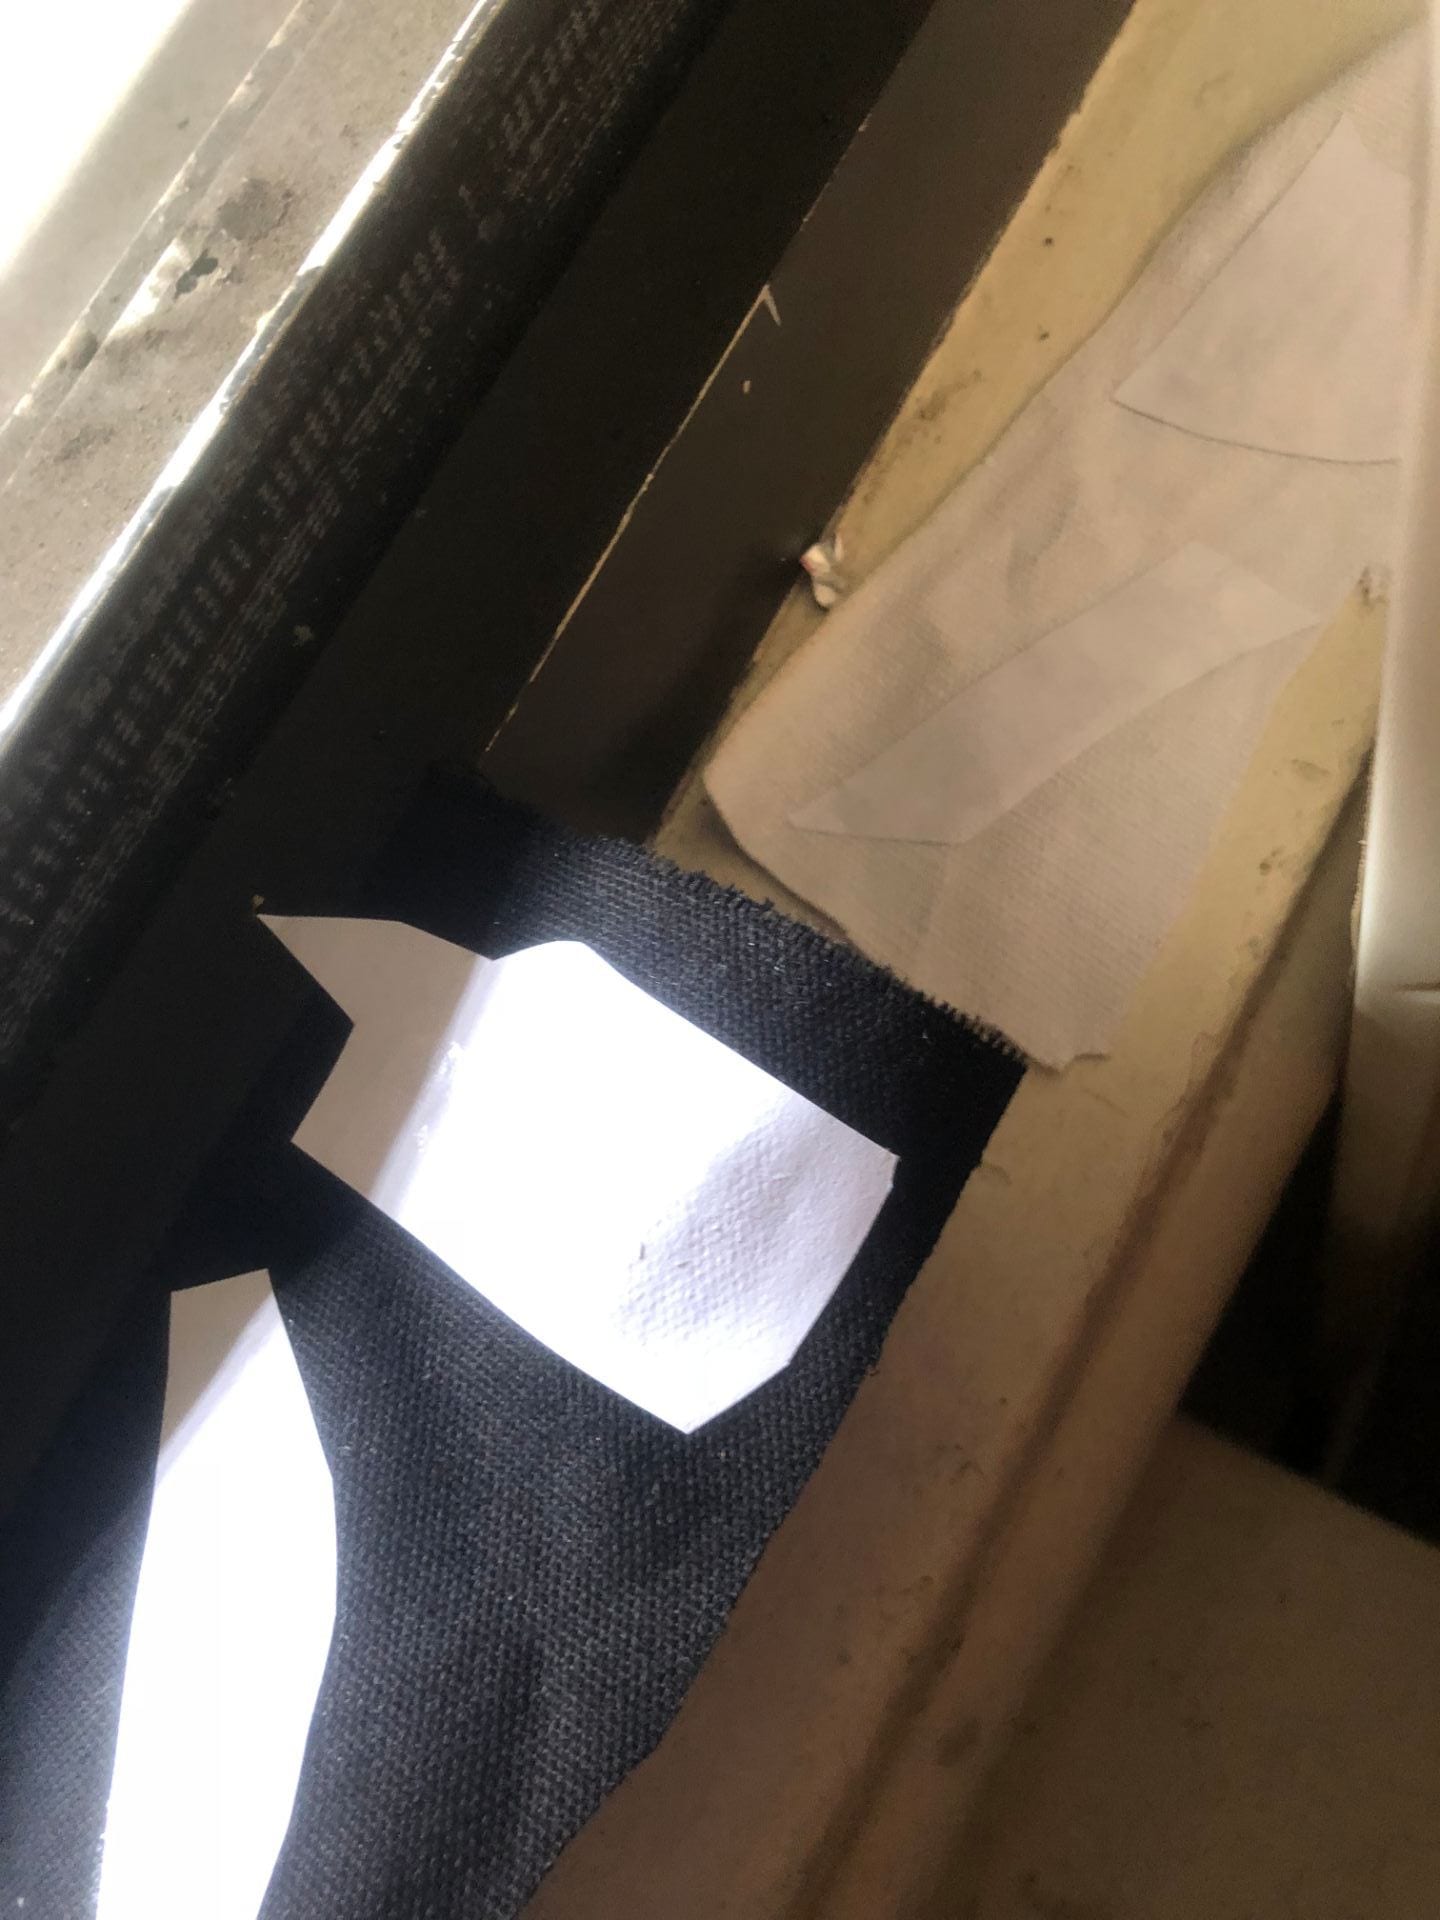
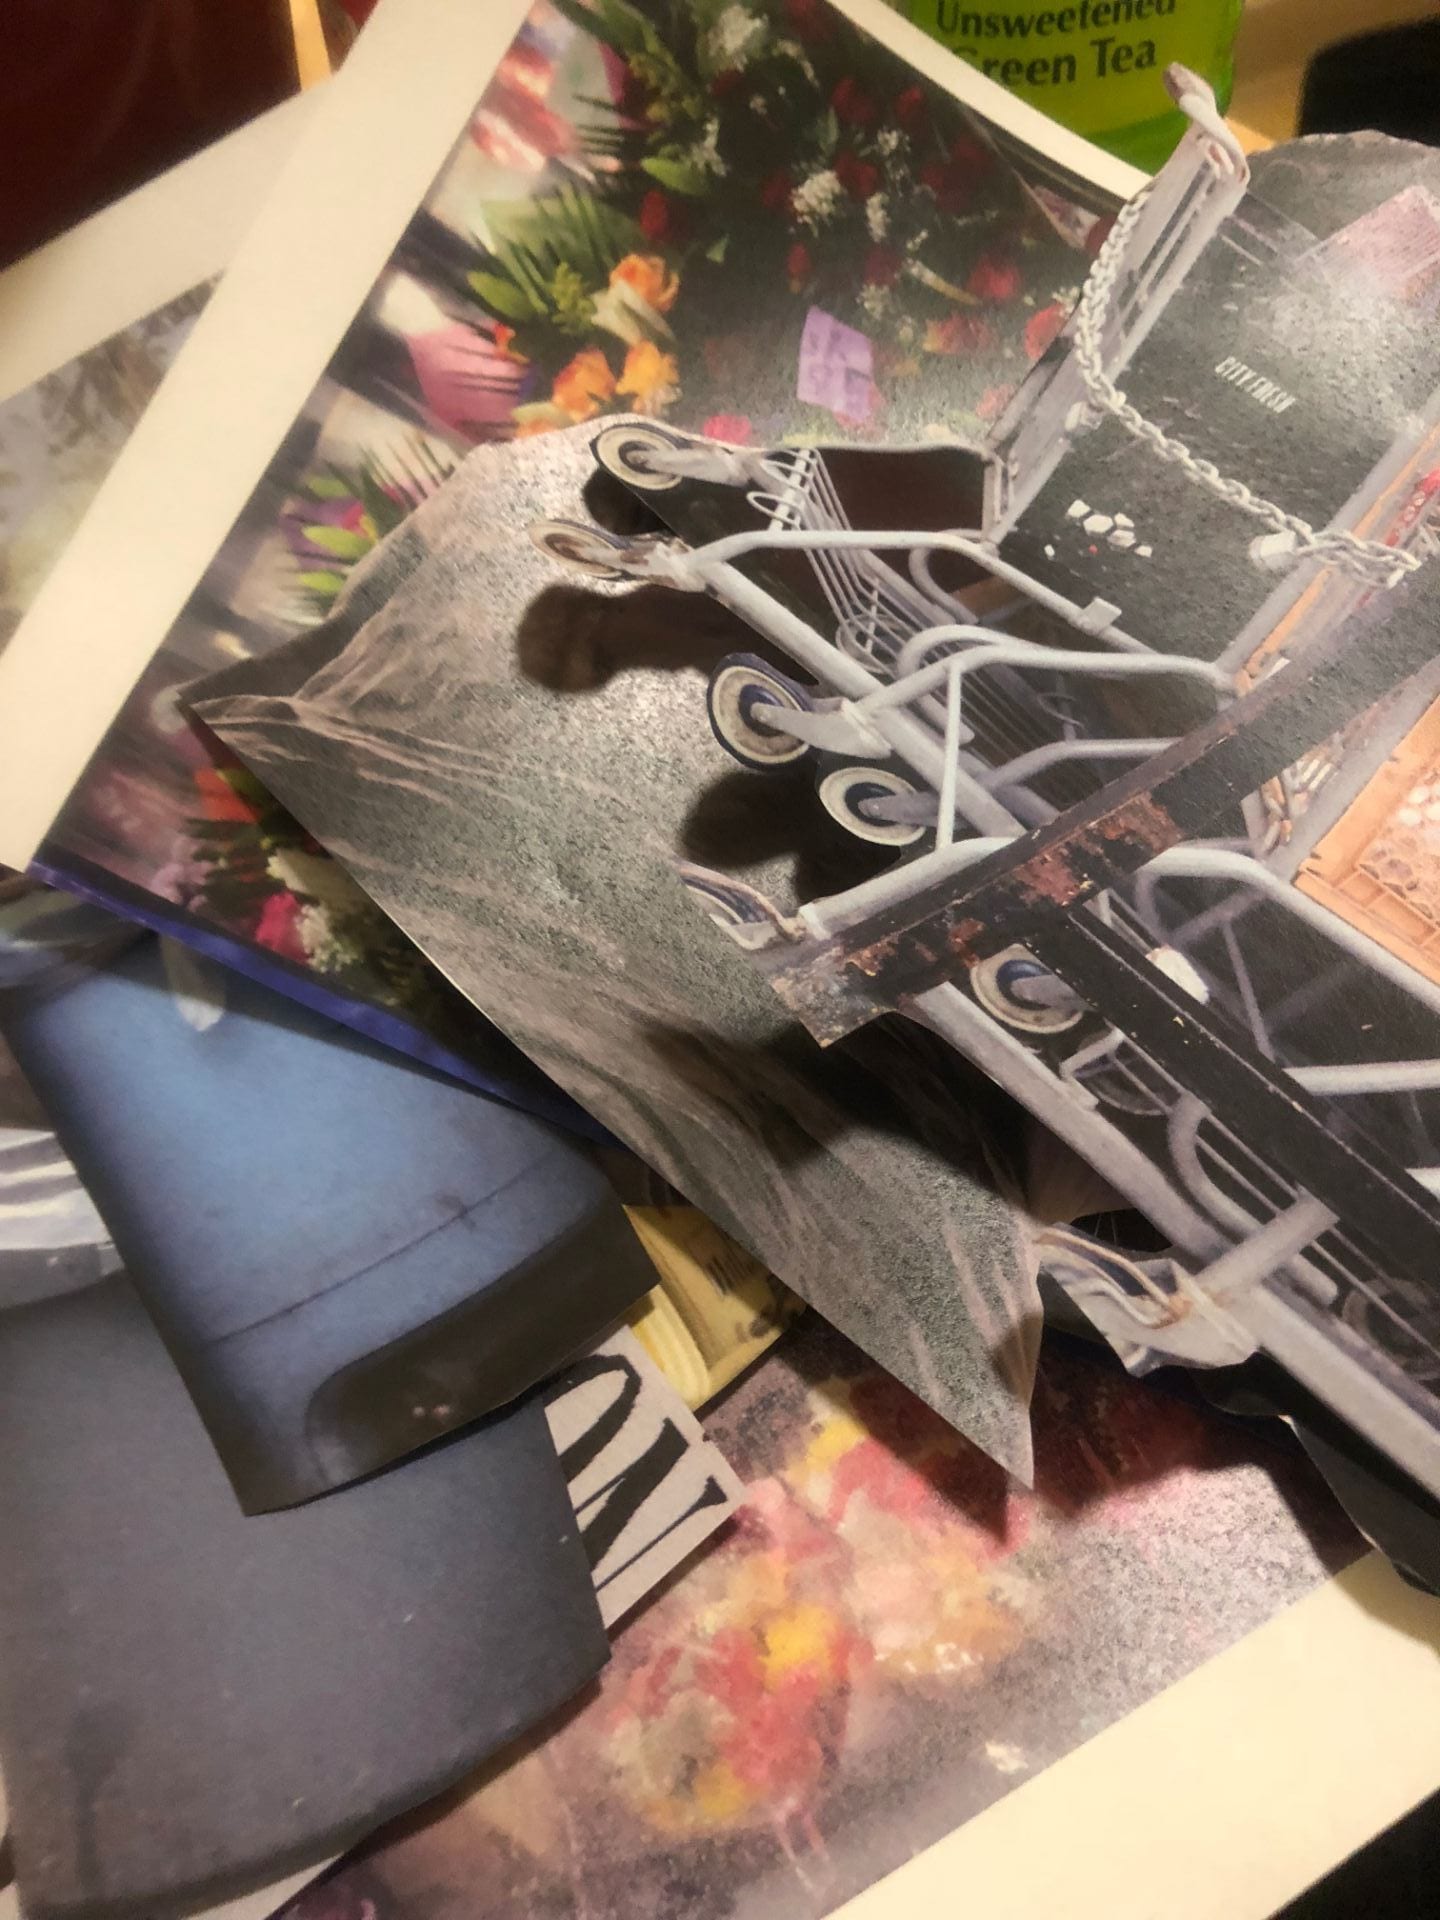
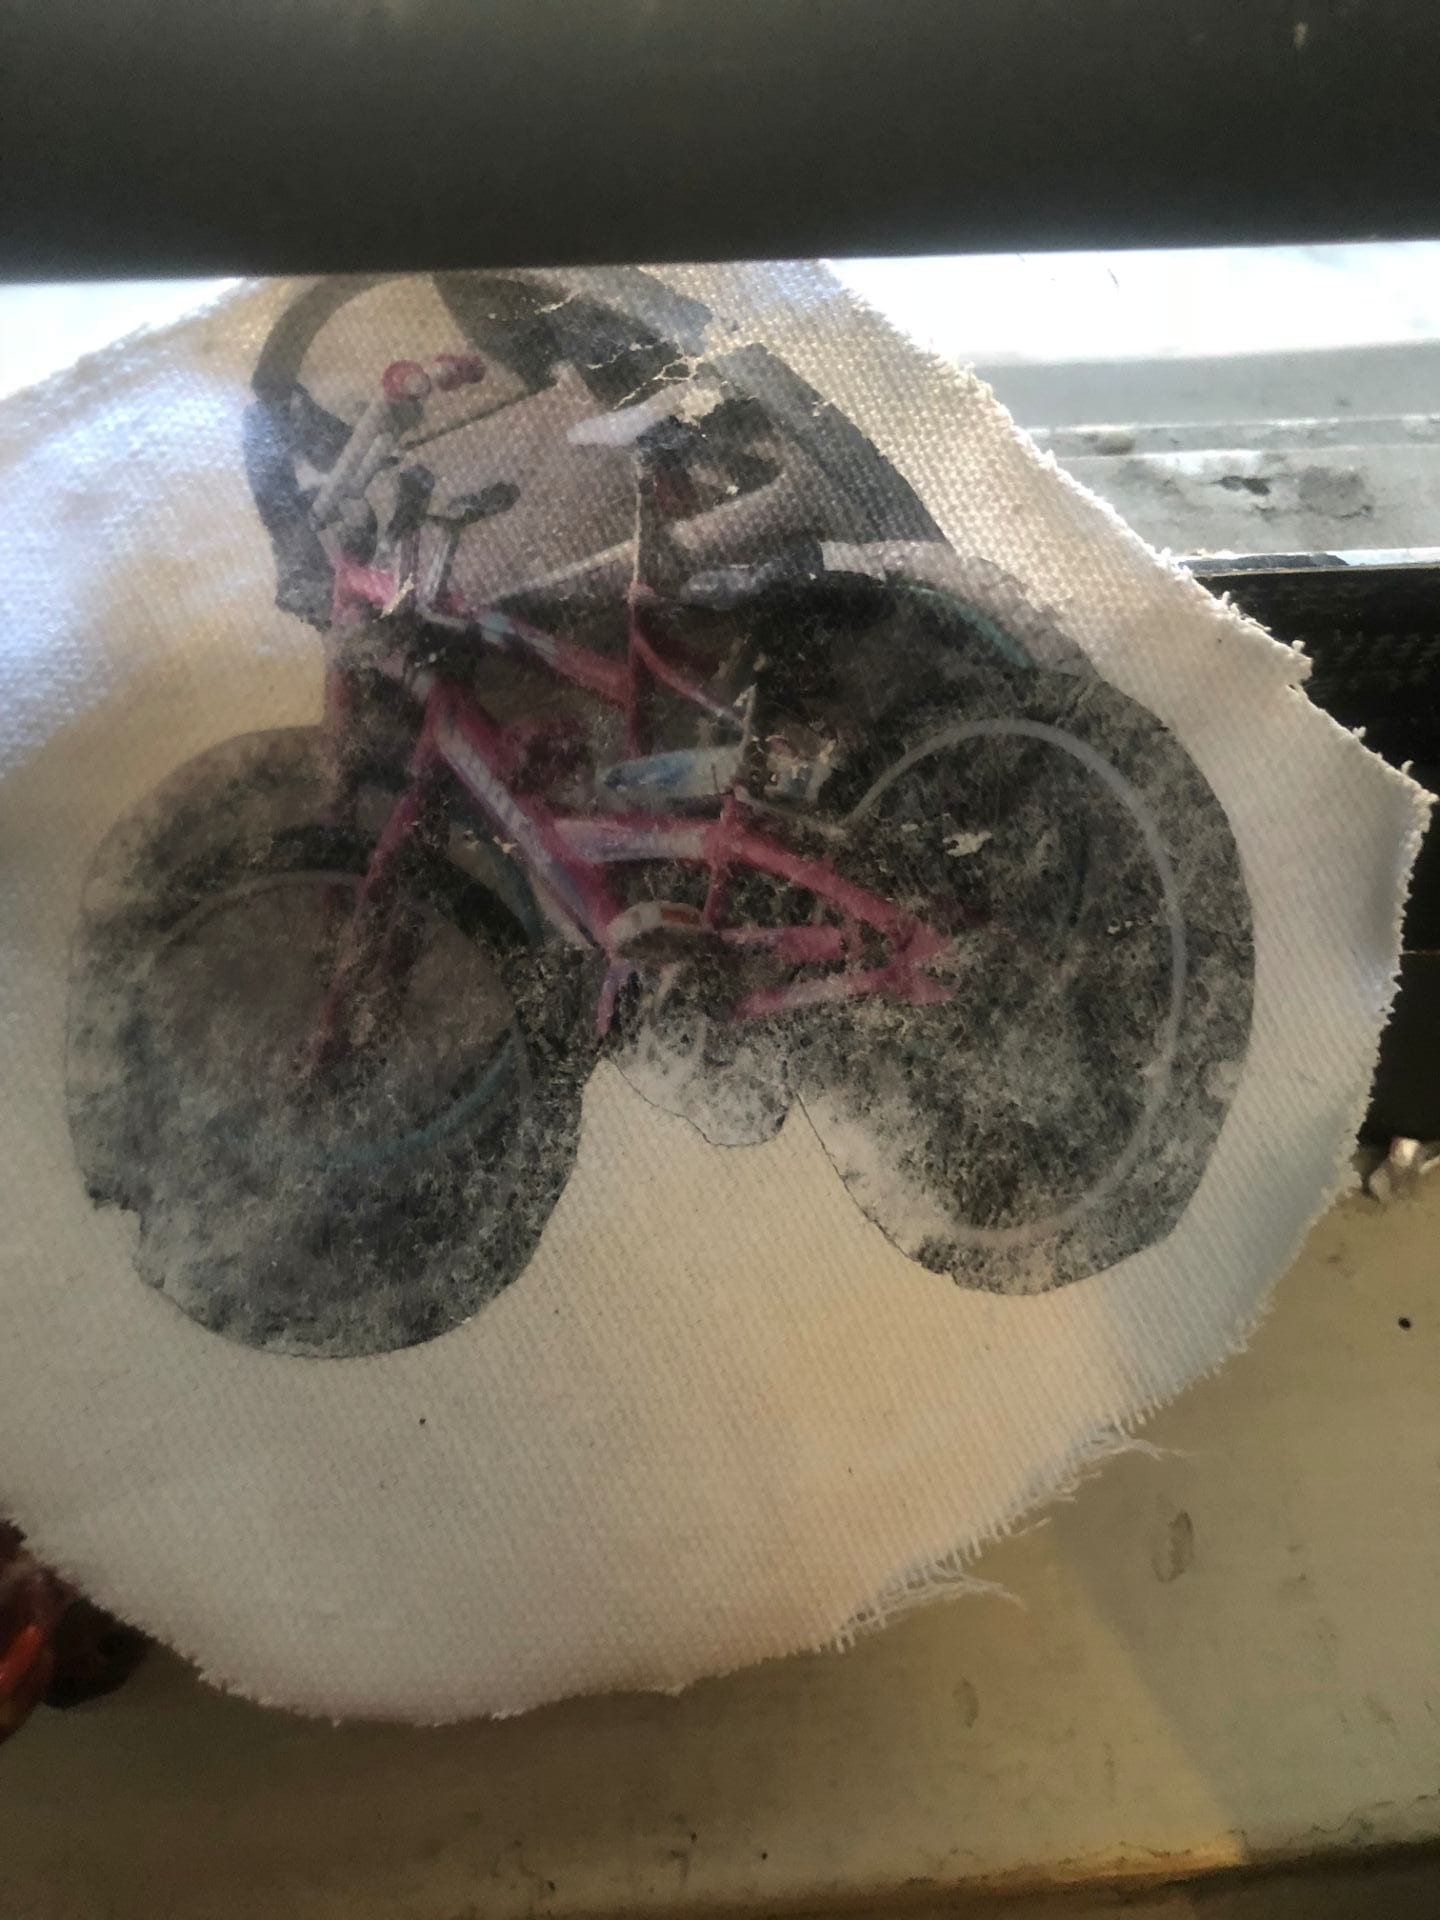
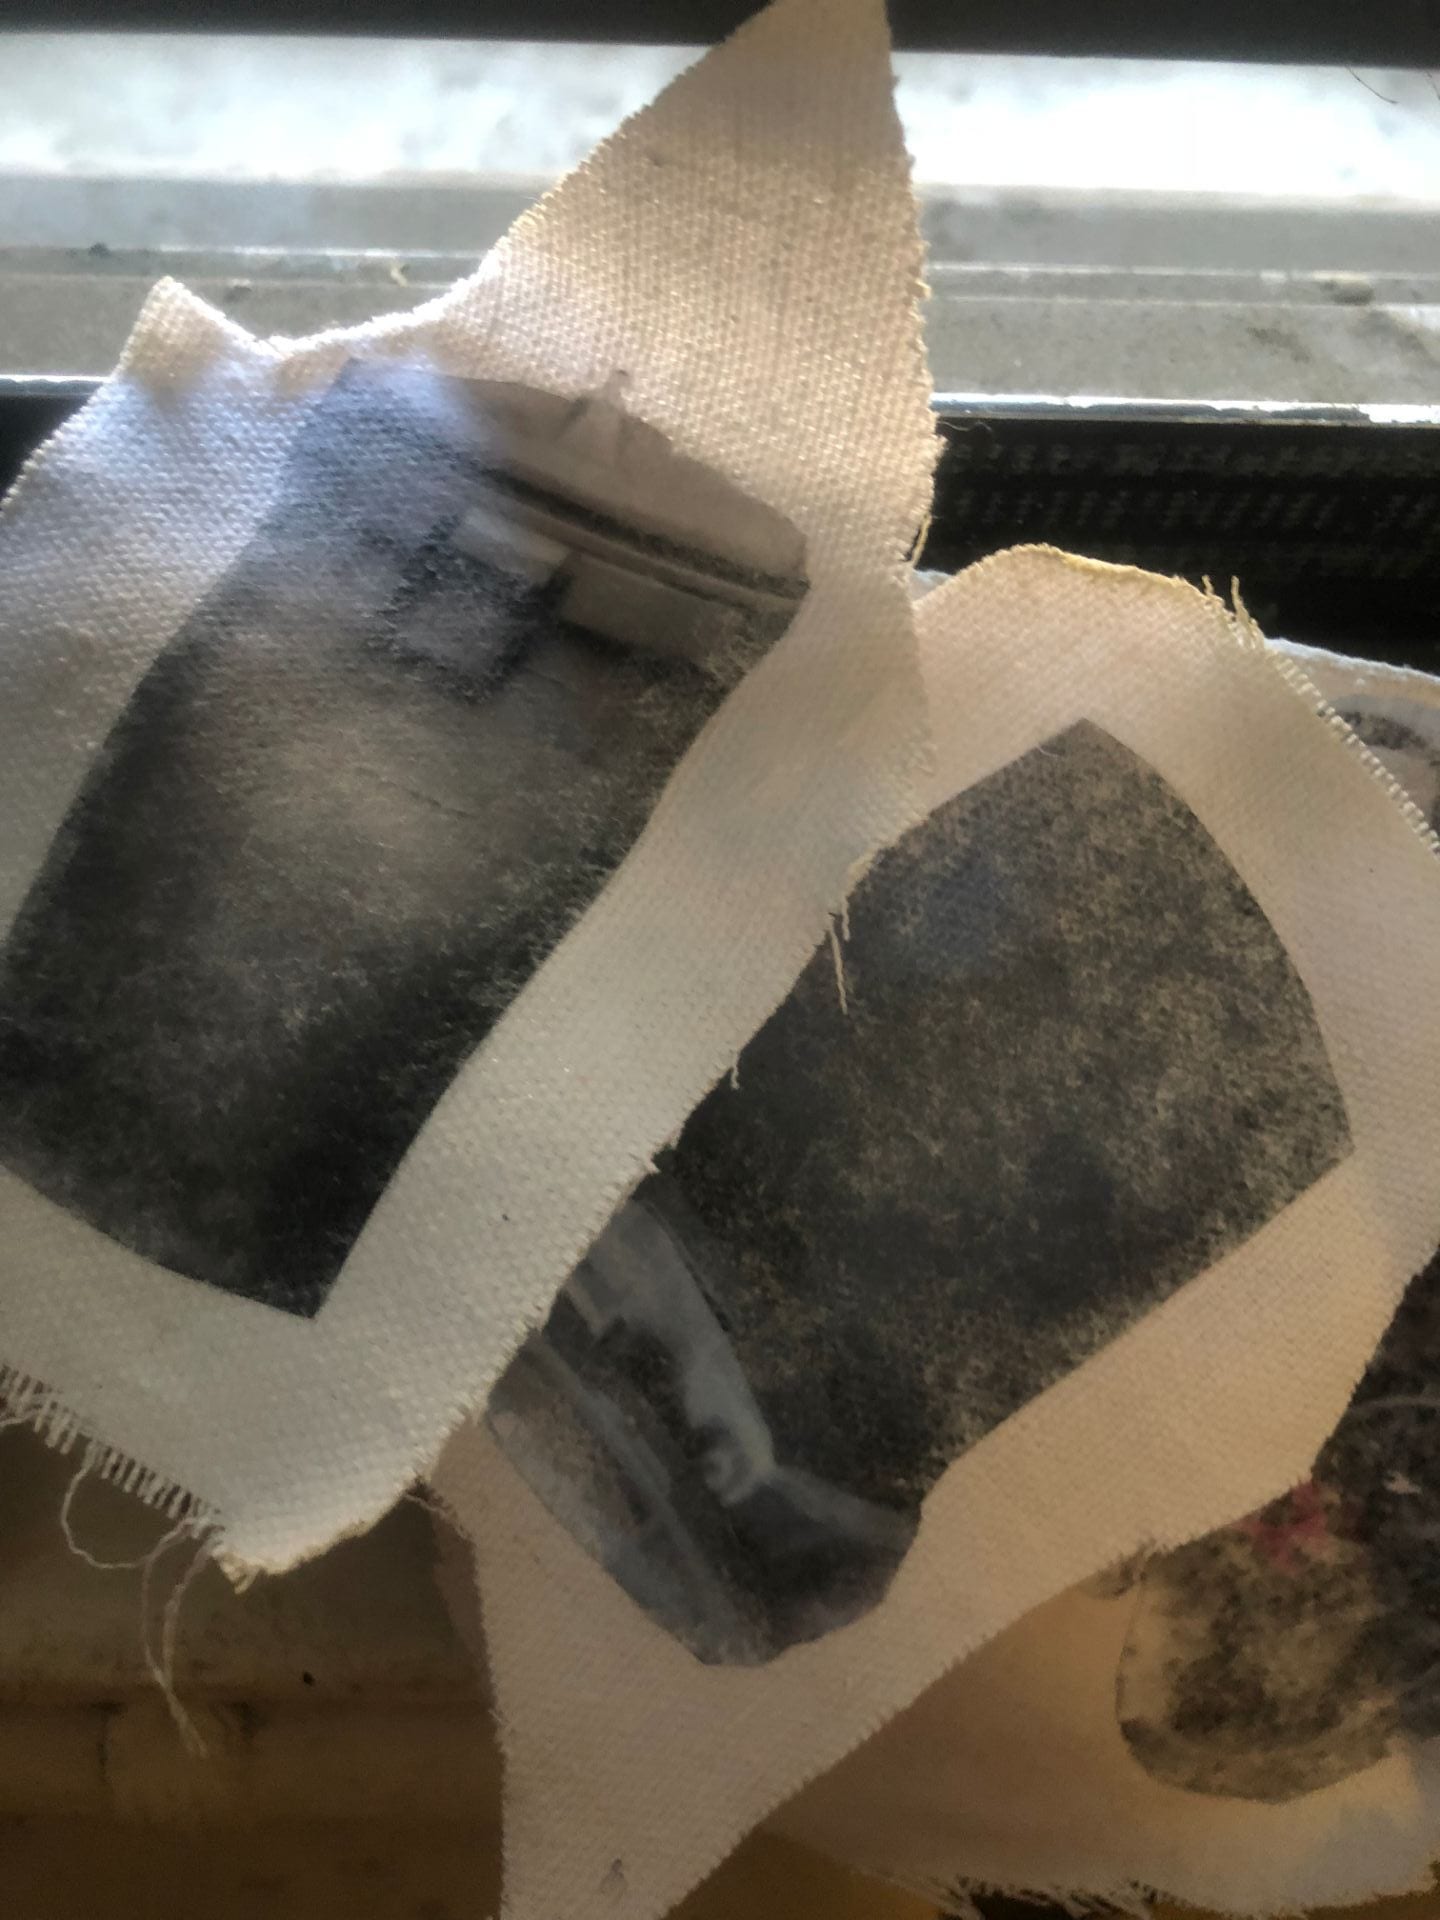
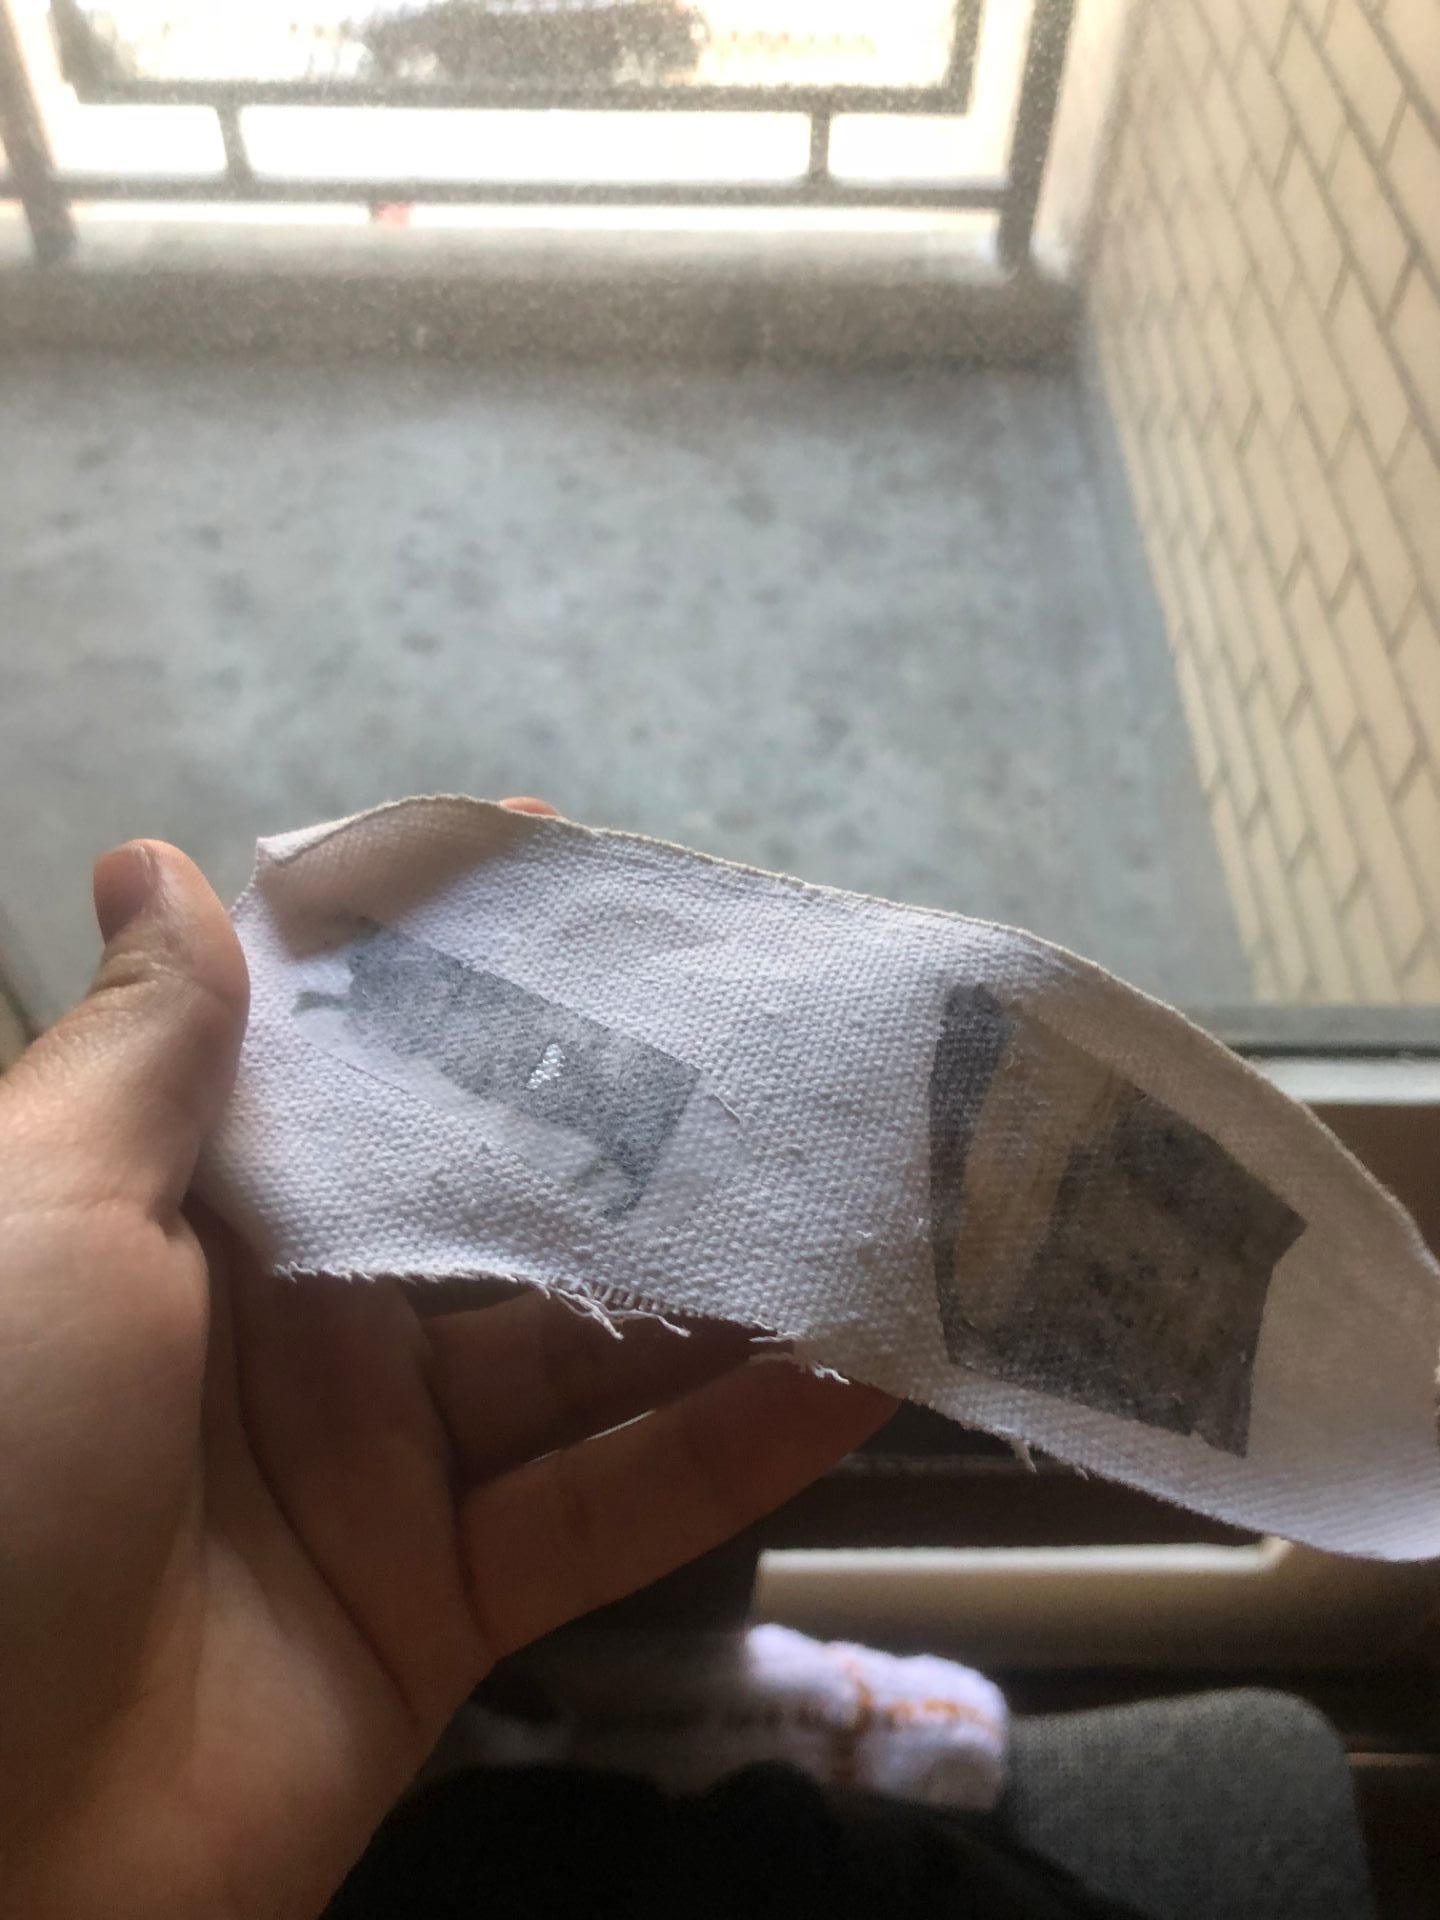
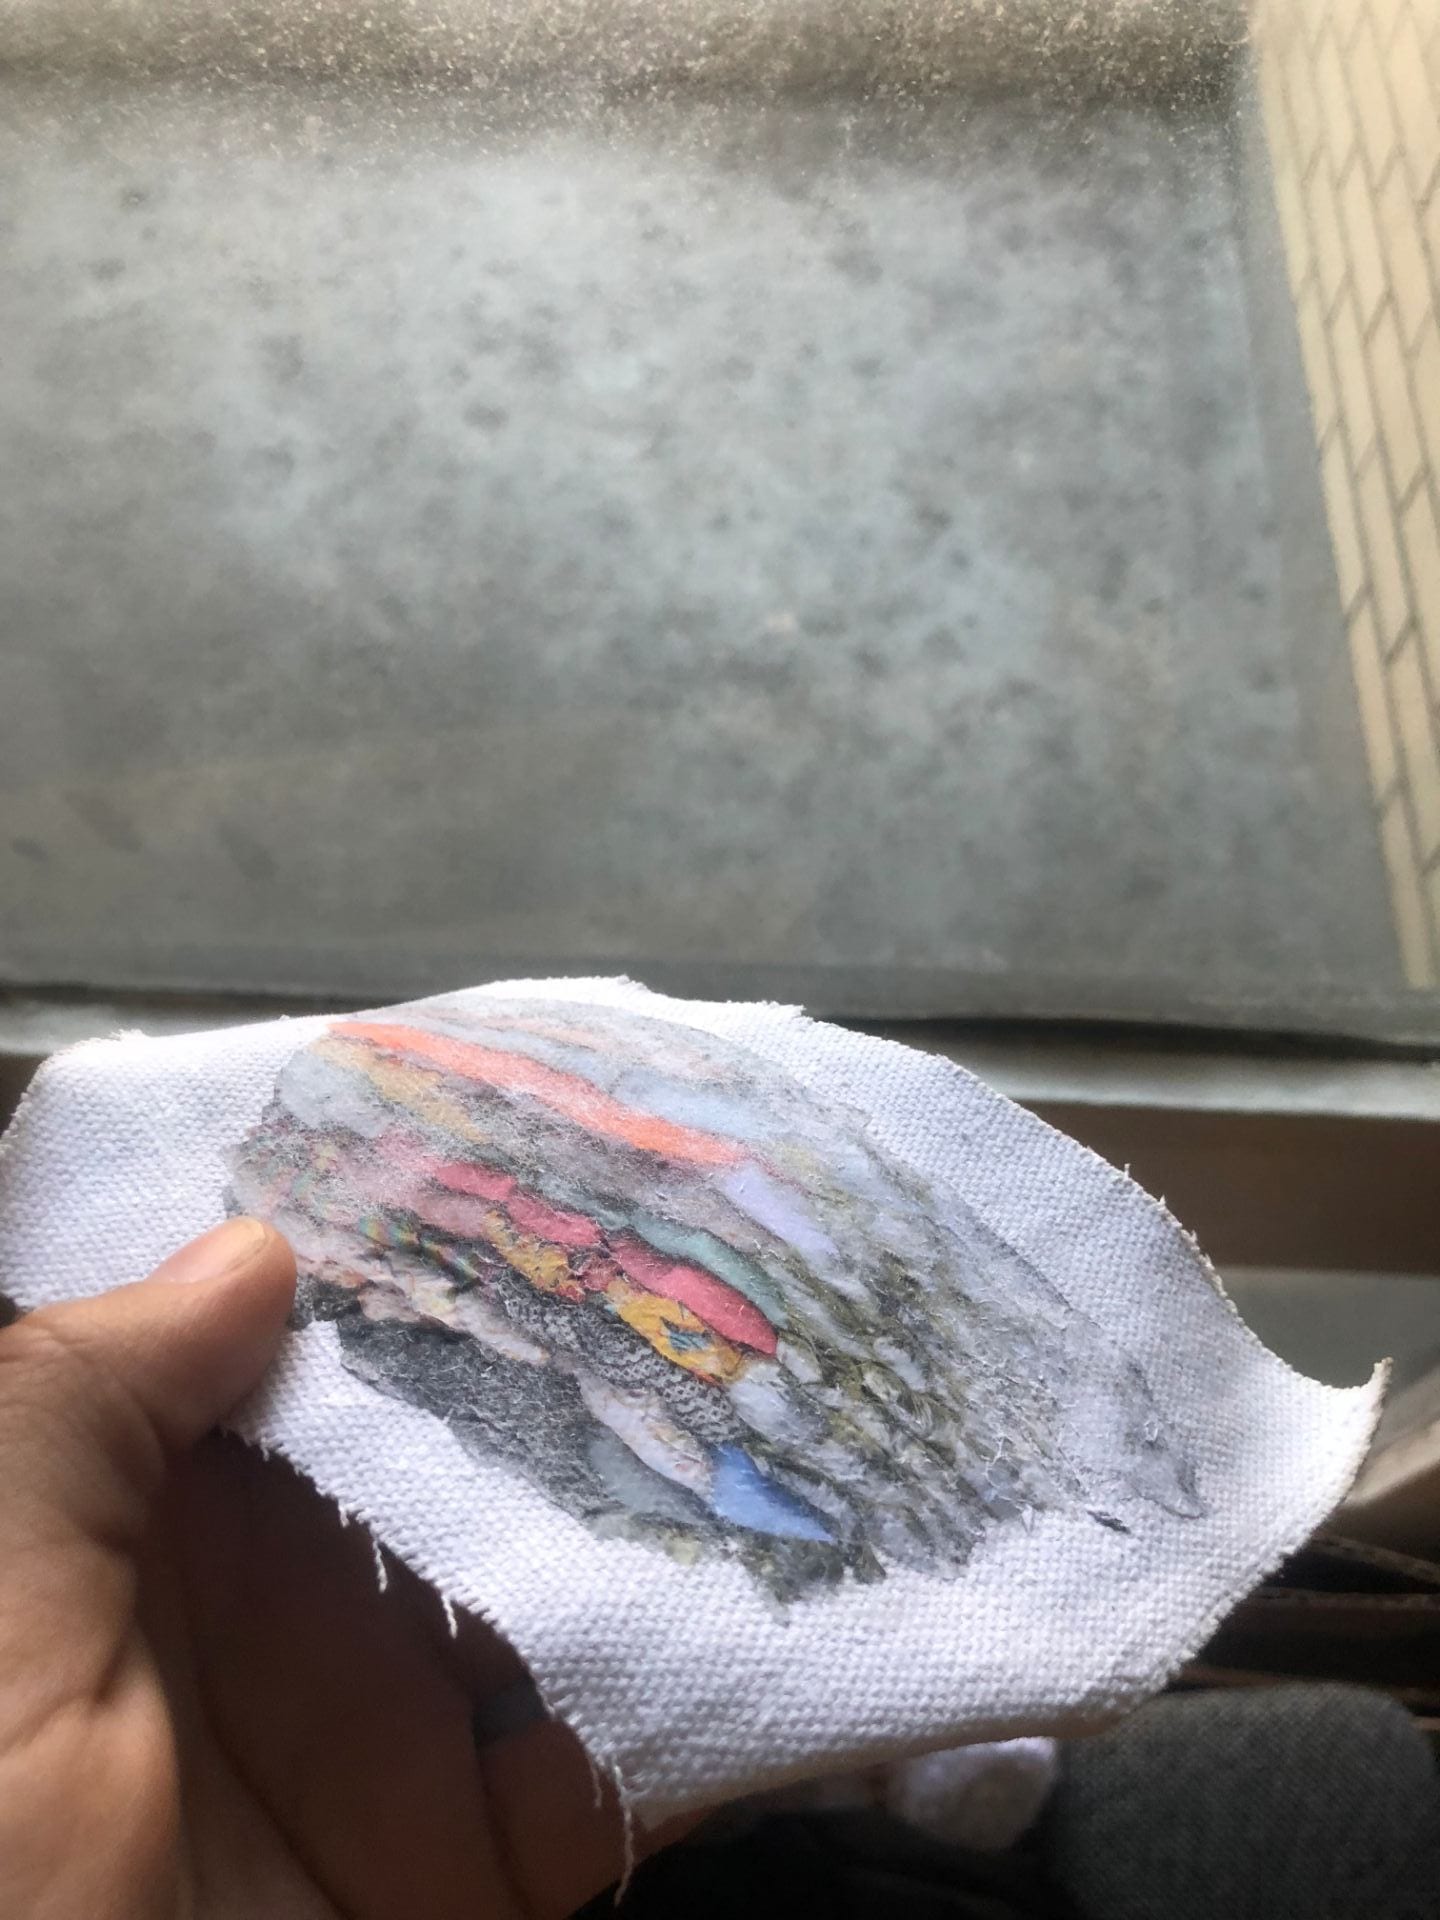
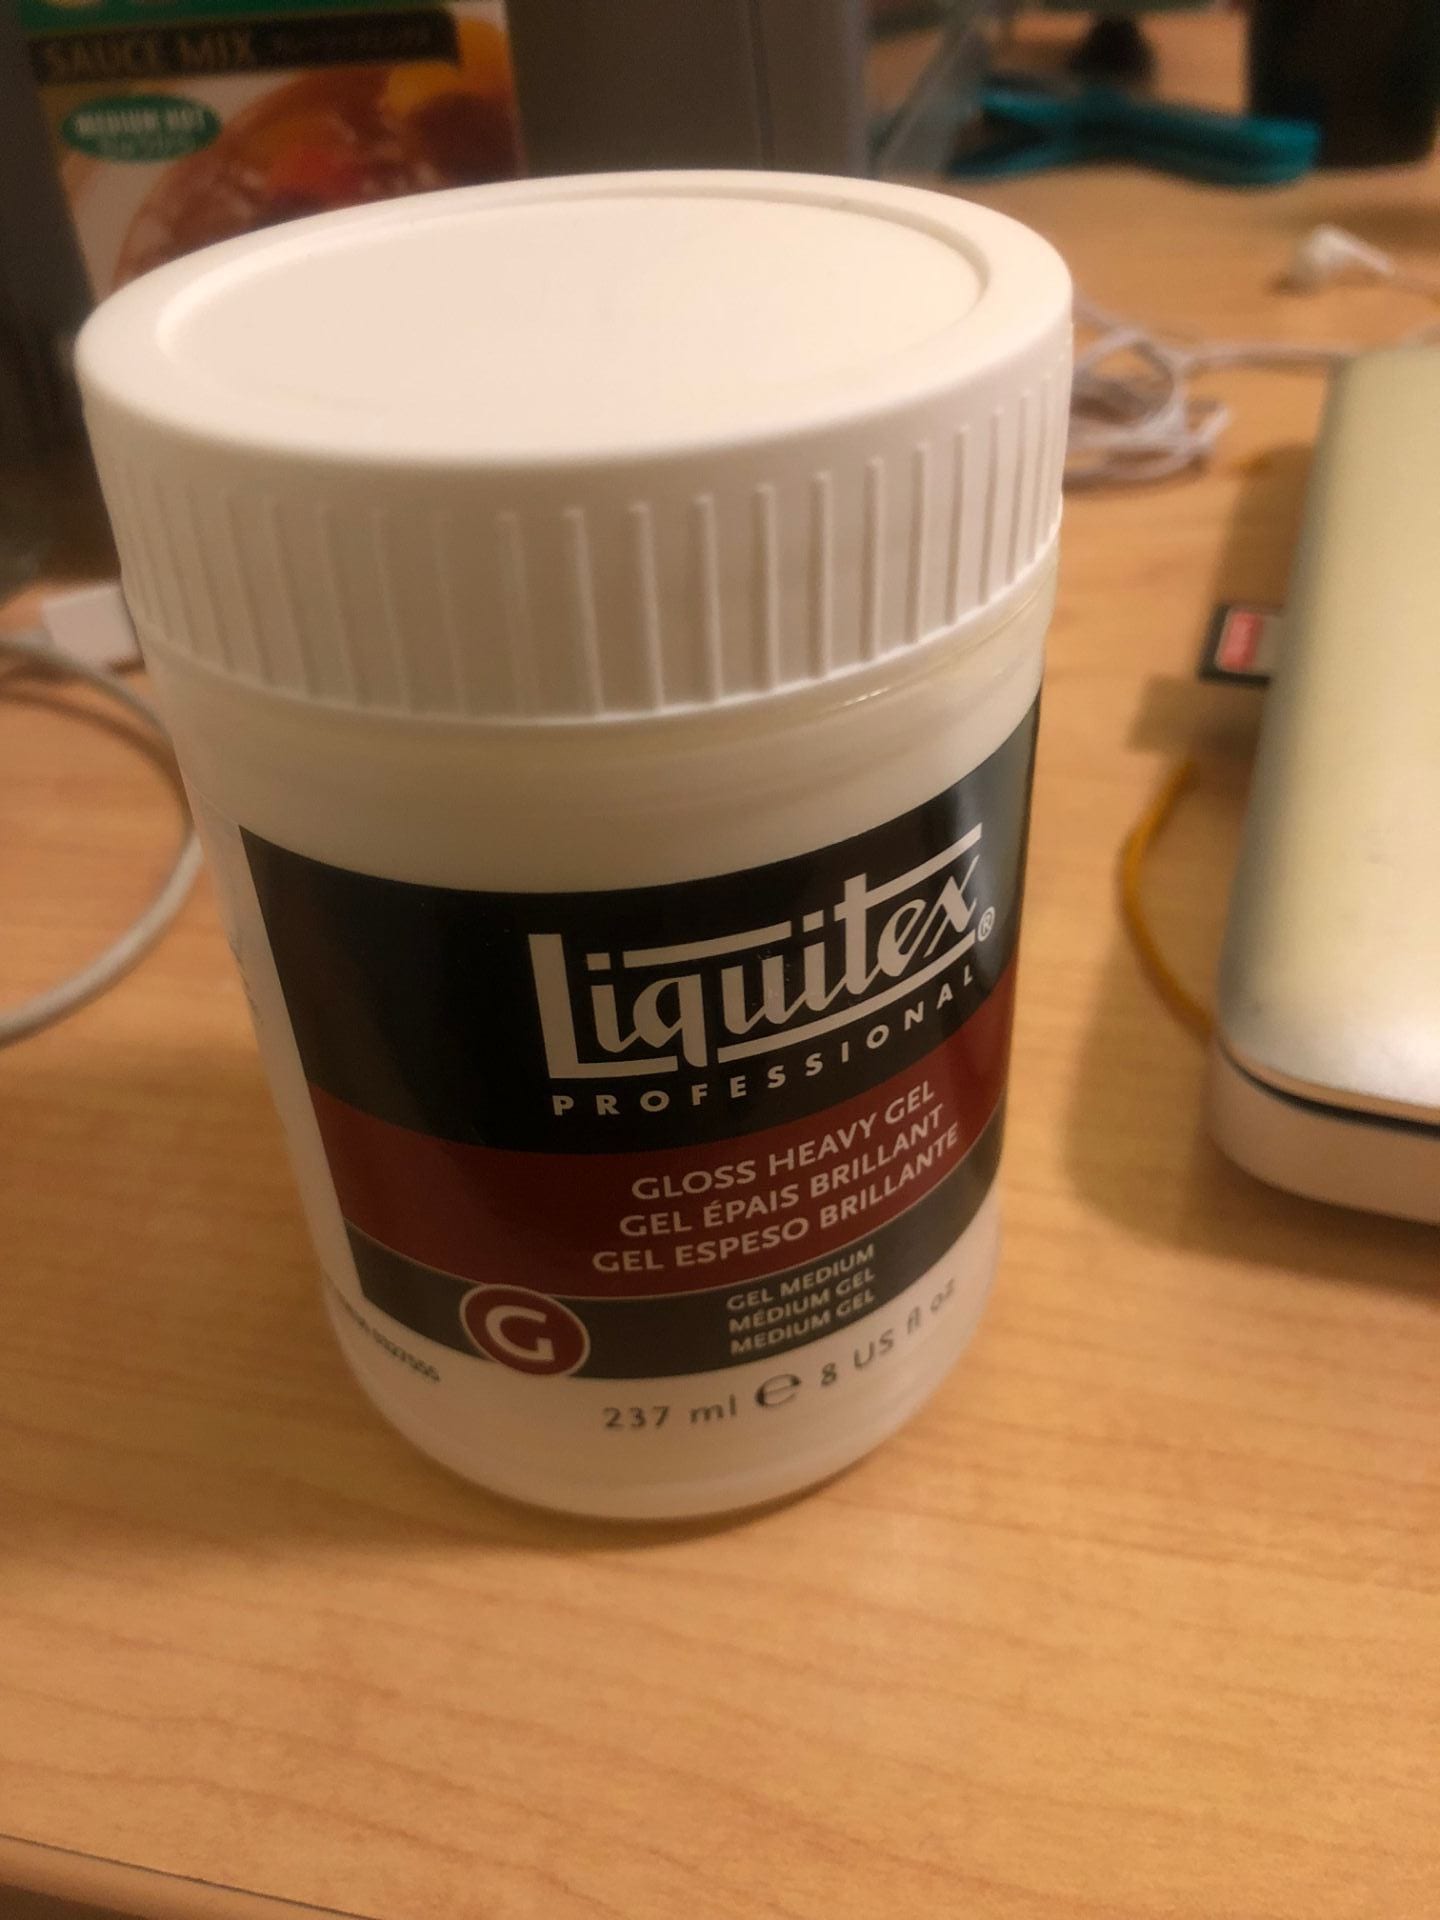
I used a heavy gloss to coat the pictures and press them into the fabric. I then let them dry overnight, so it could set and used water to rinse them the next day, and let them dry for a few hours. Unfortunately it went wrong for a combination of reasons, but I decided to still use fabric and photos, I just did not transfer/ attach them directly as I feel I was not experienced or knowledgeable enough to, but I am glad I attempted this new method.
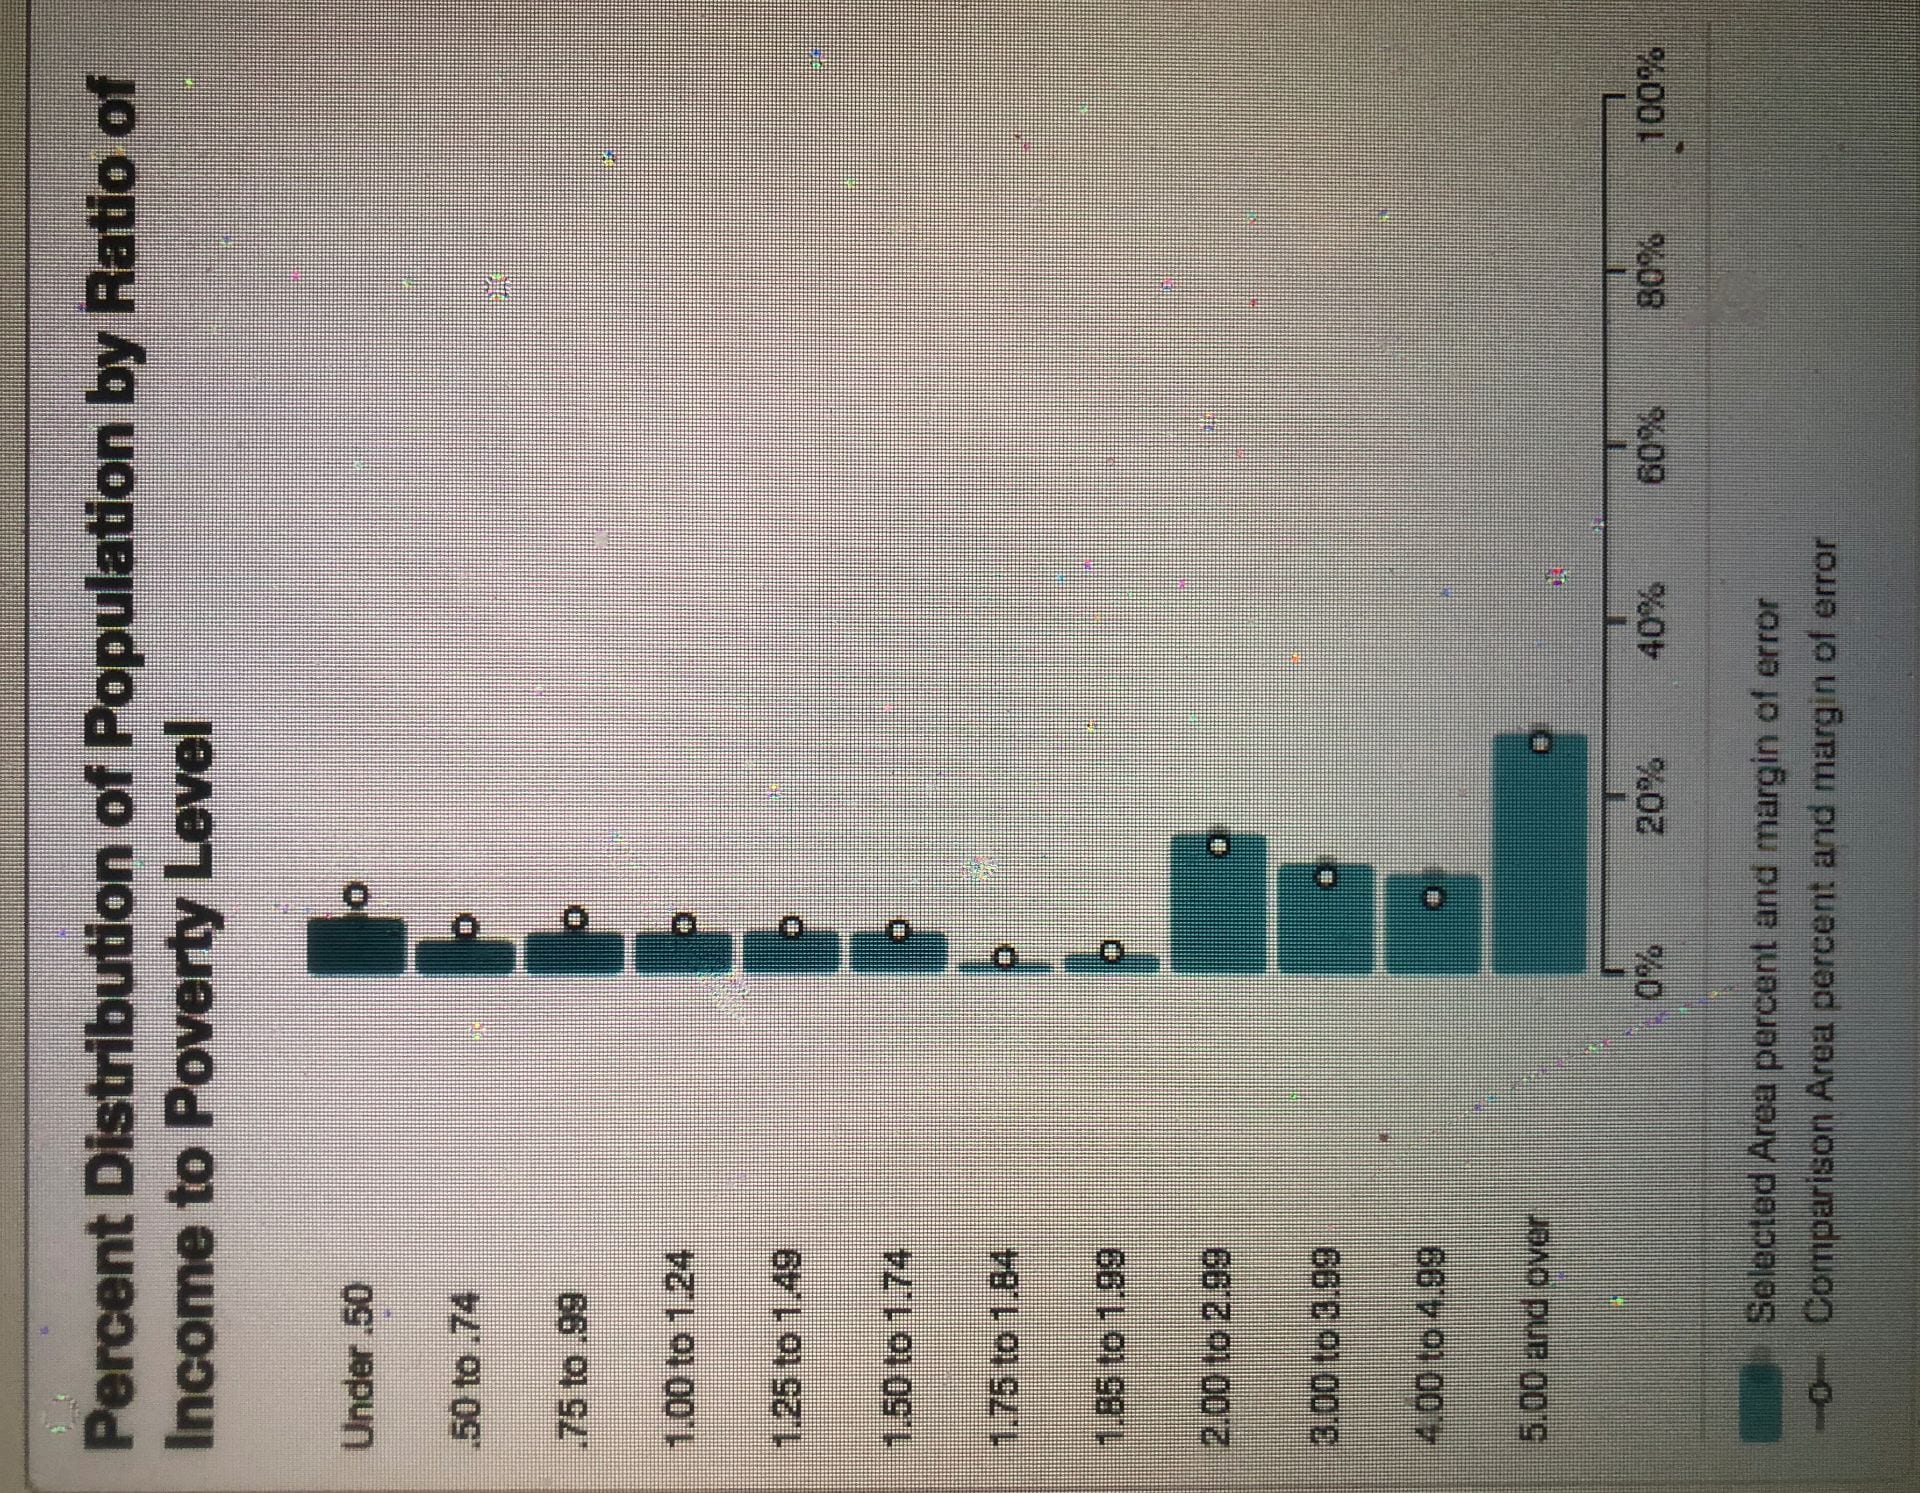
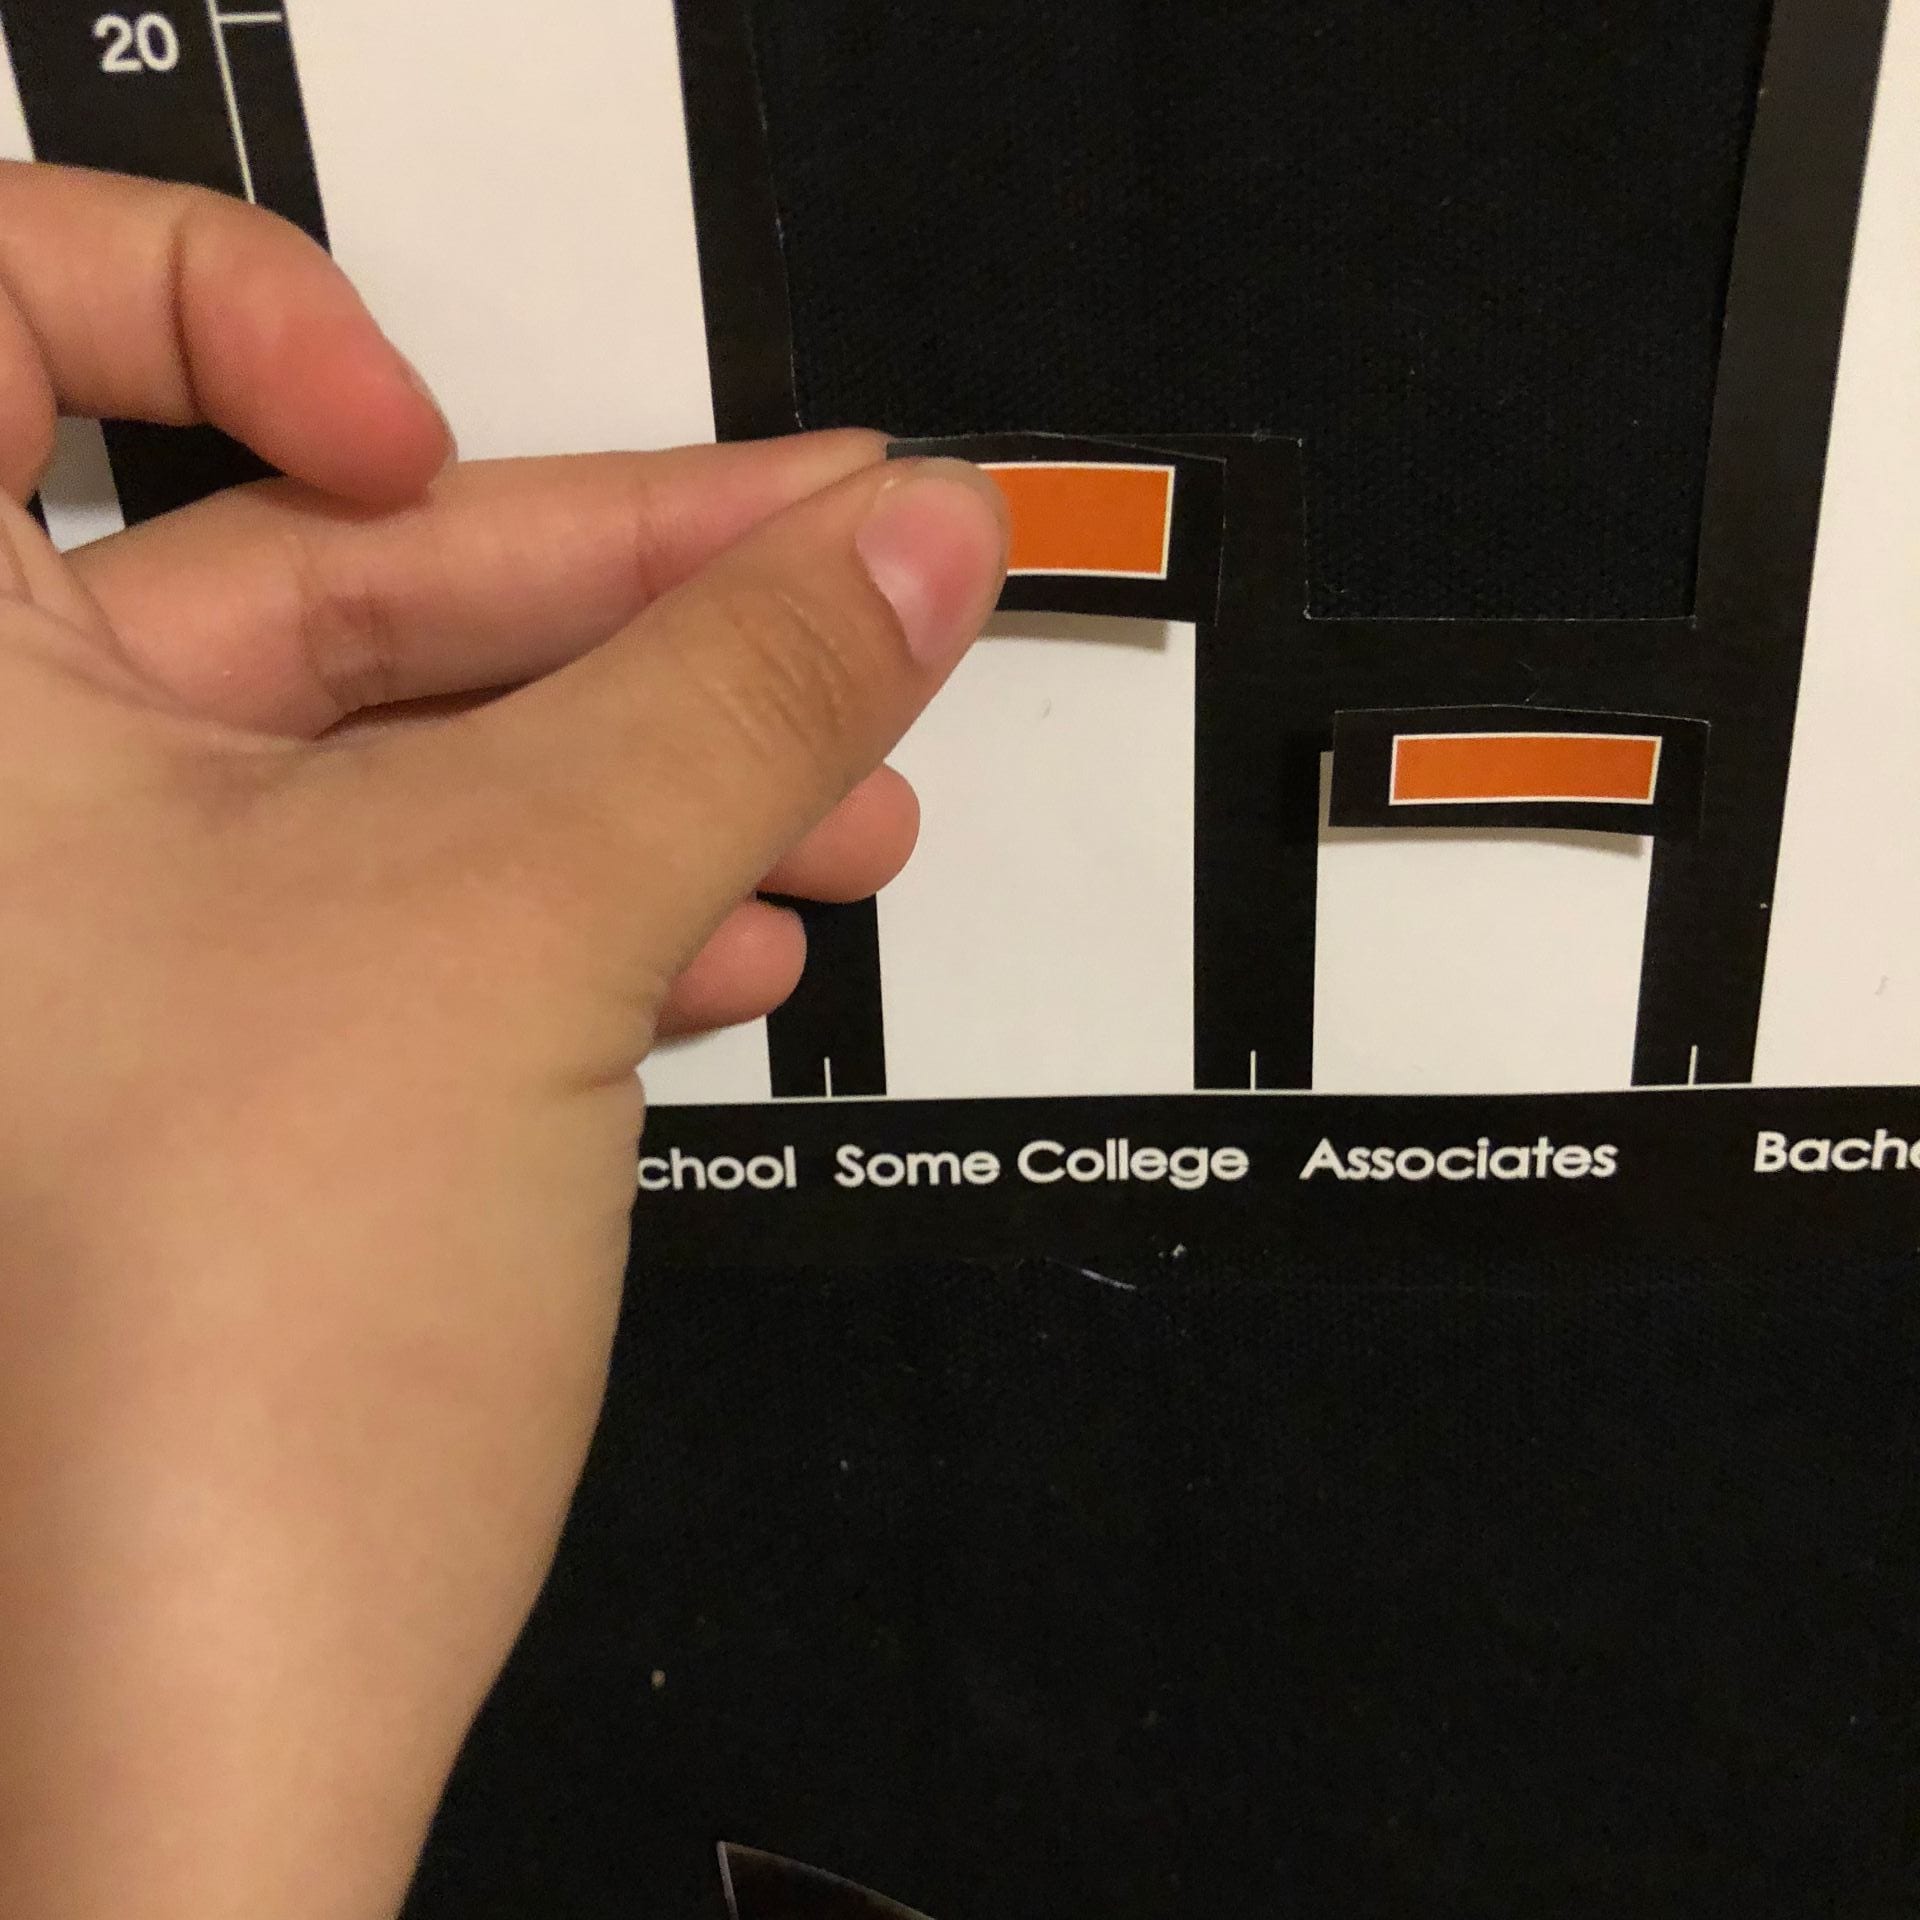
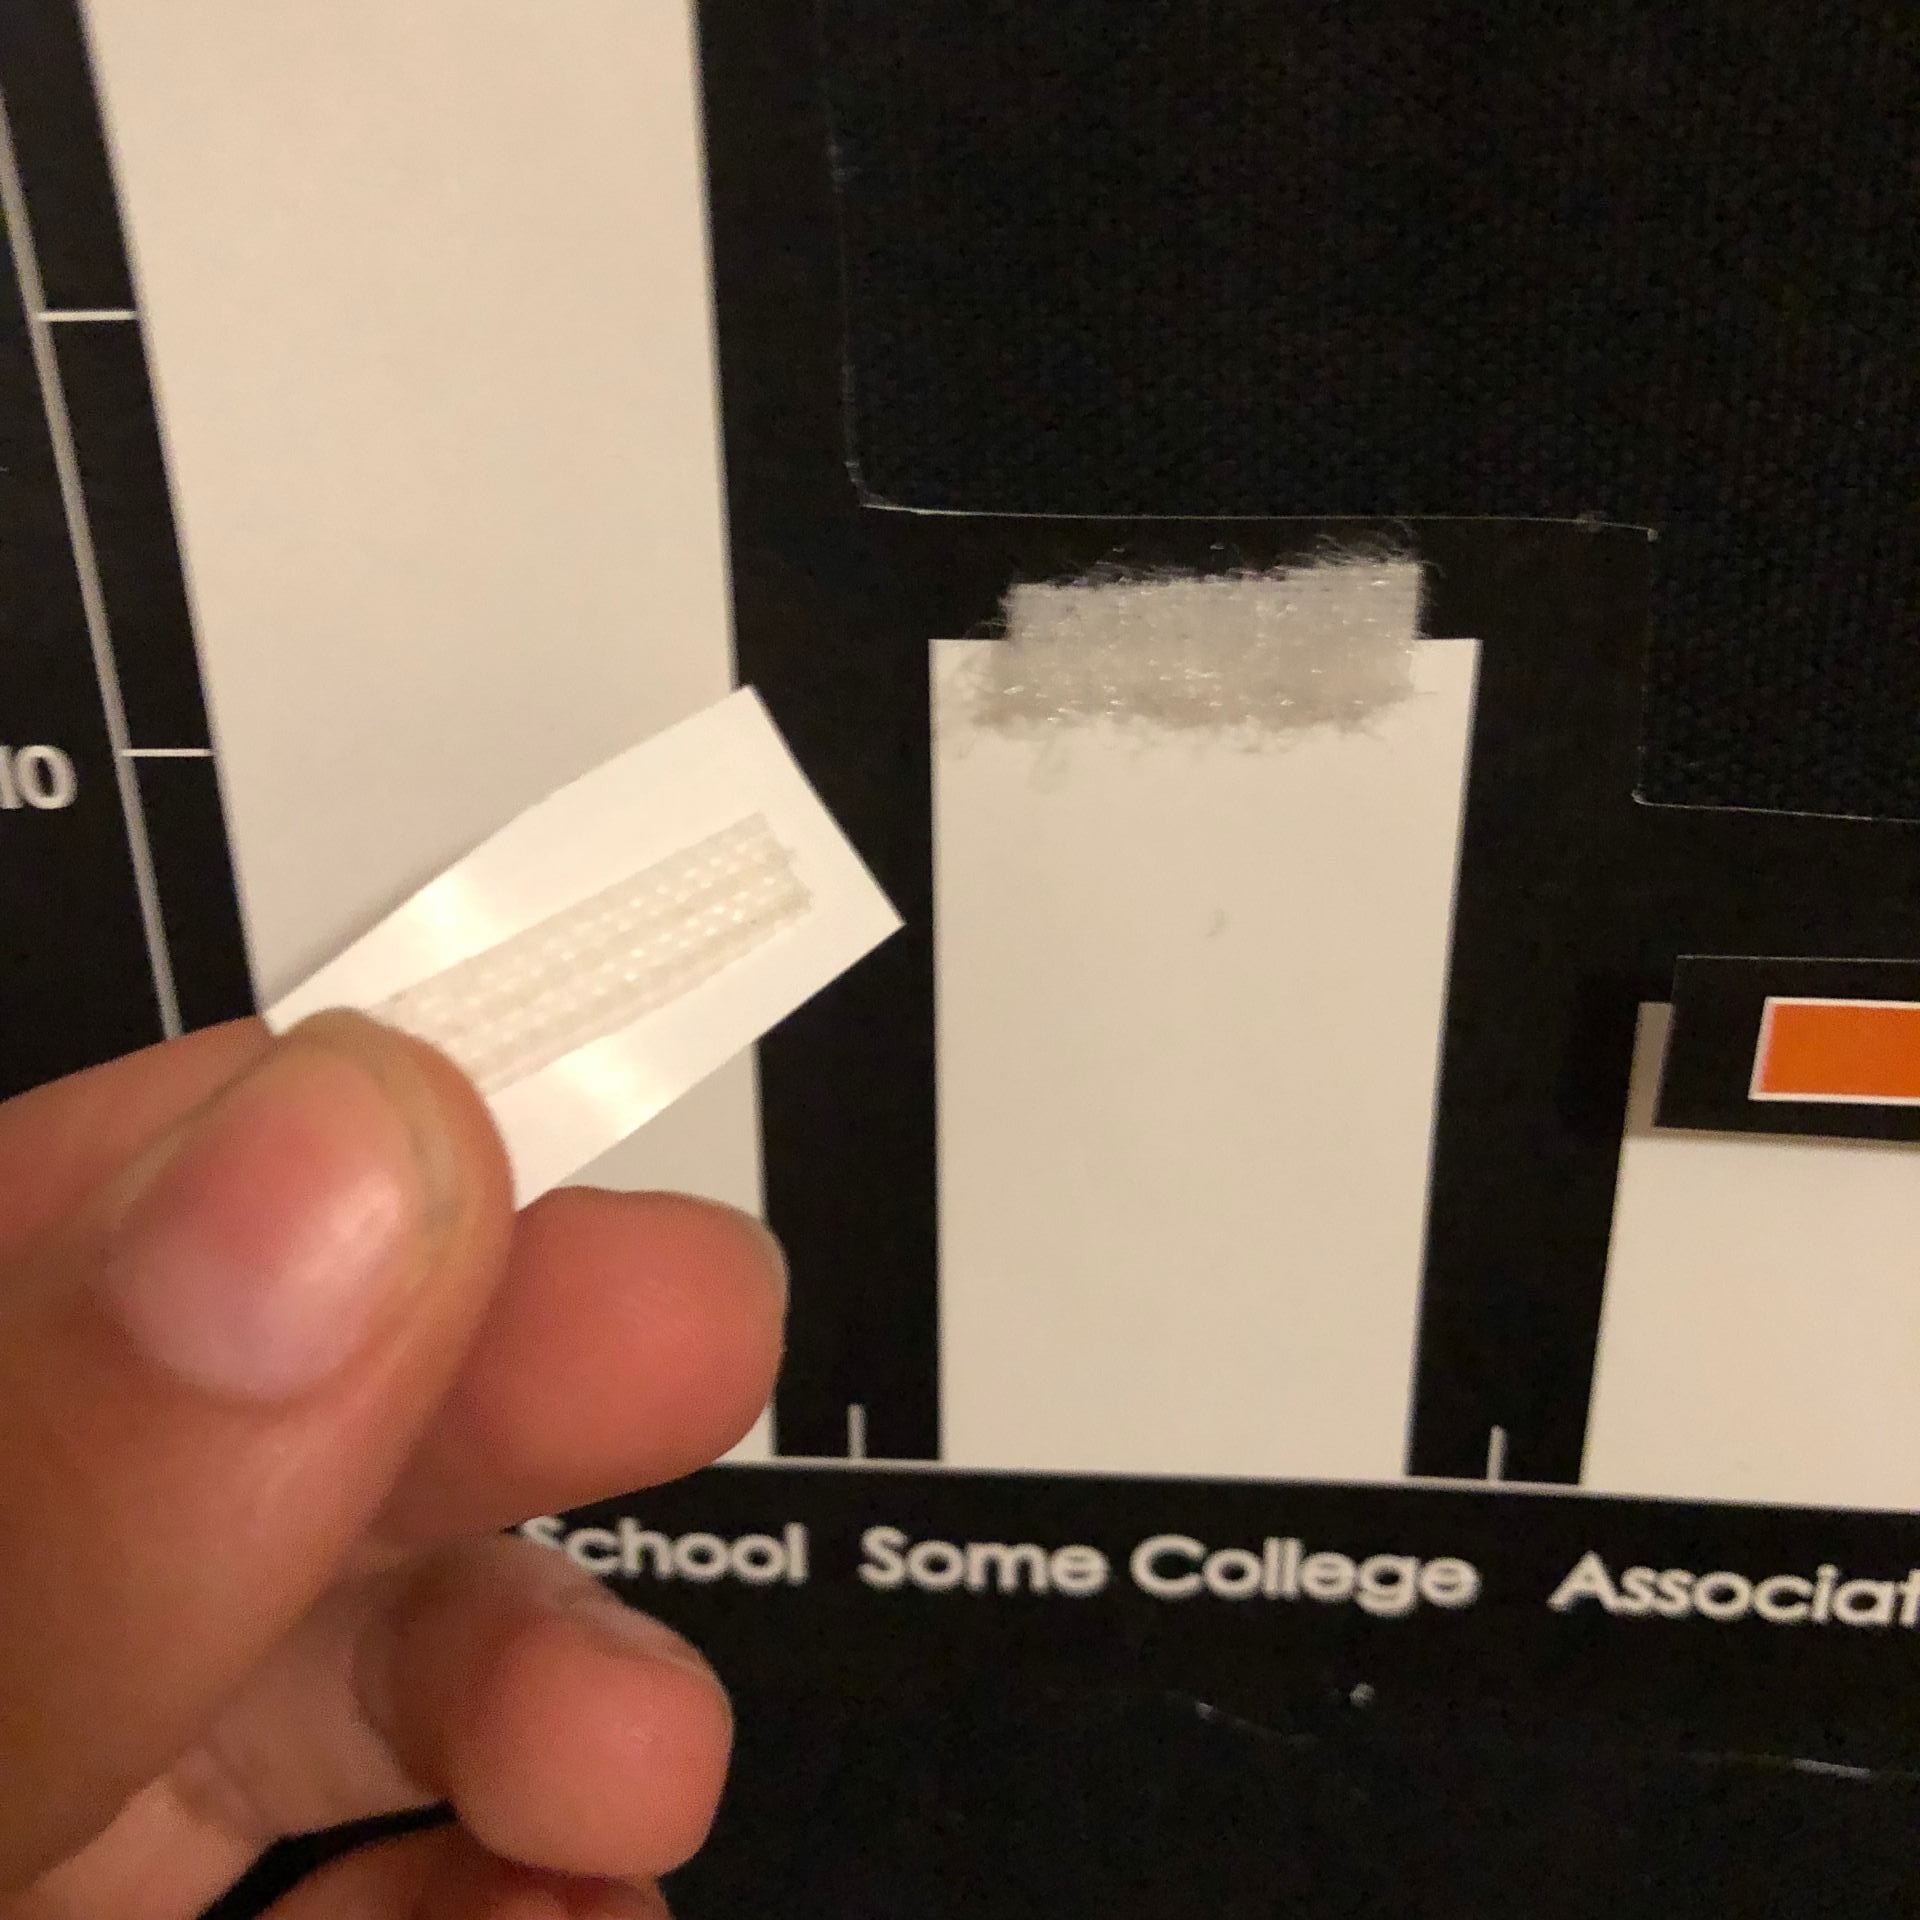
I wanted to make the chart interactive or interesting so I decided to add the Velcro margin of error. The information of the website while intriguing, i felt it was an interesting aspect to have a margin of error that was occasionally pretty high. Even though the particular information I used, college level in Astoria, was not as high in that area I added the option to see how the information could still differ.
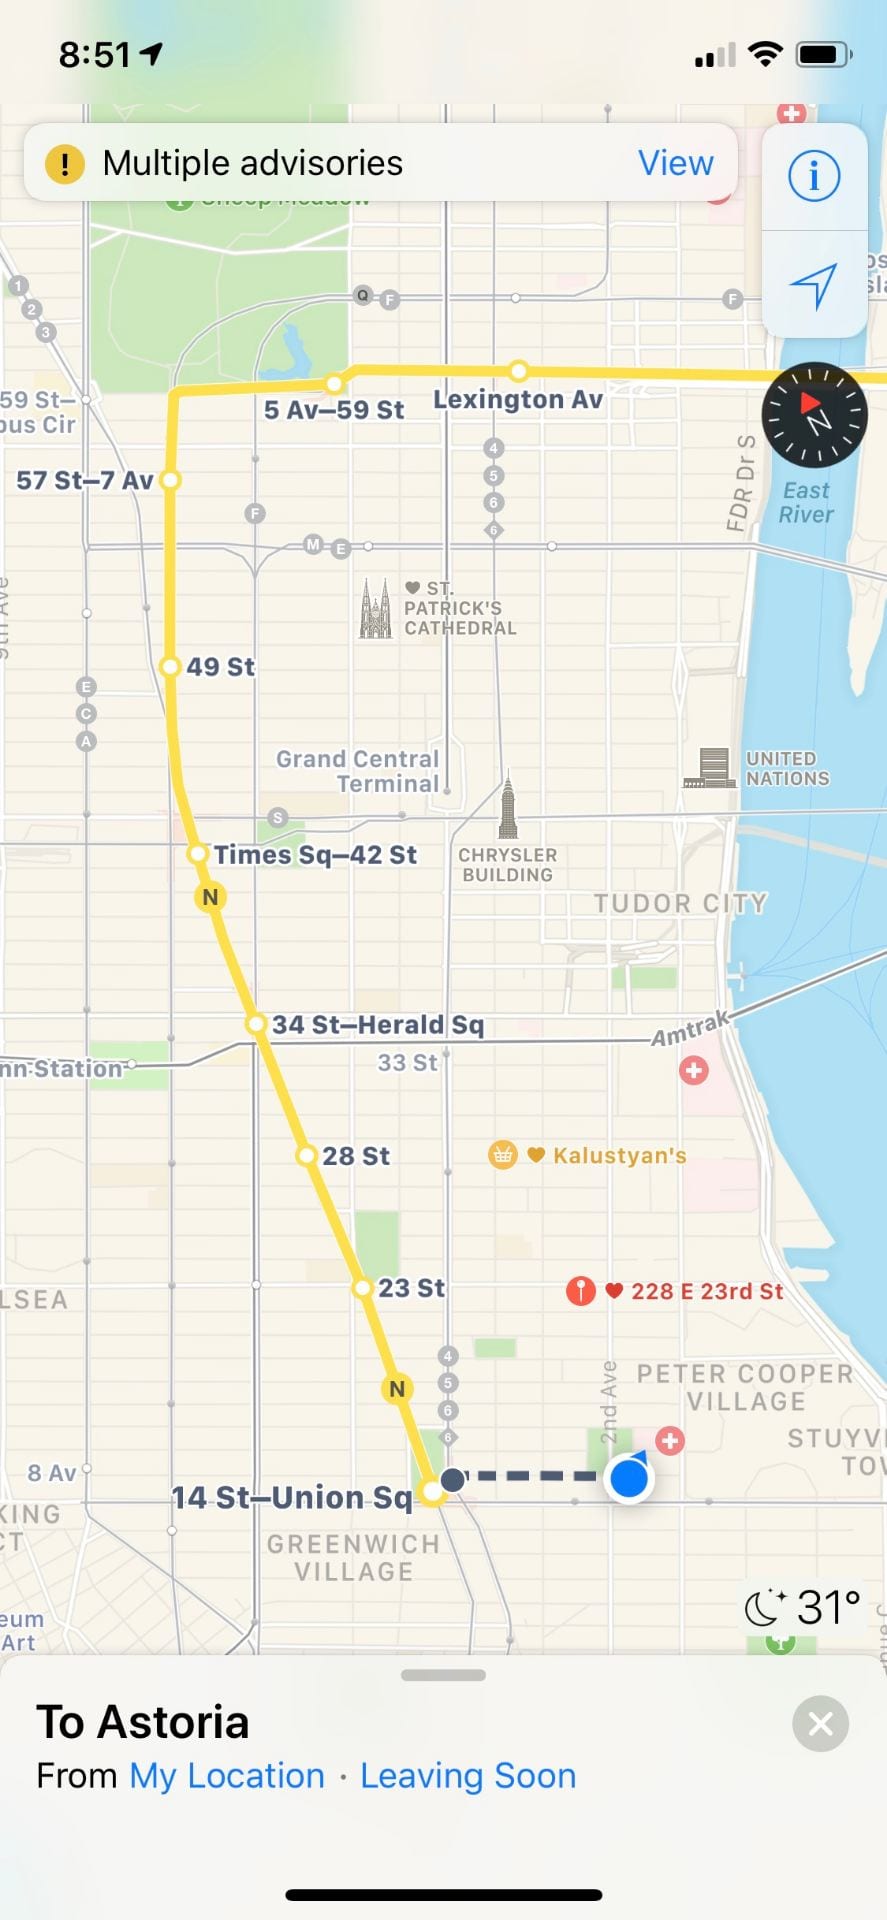
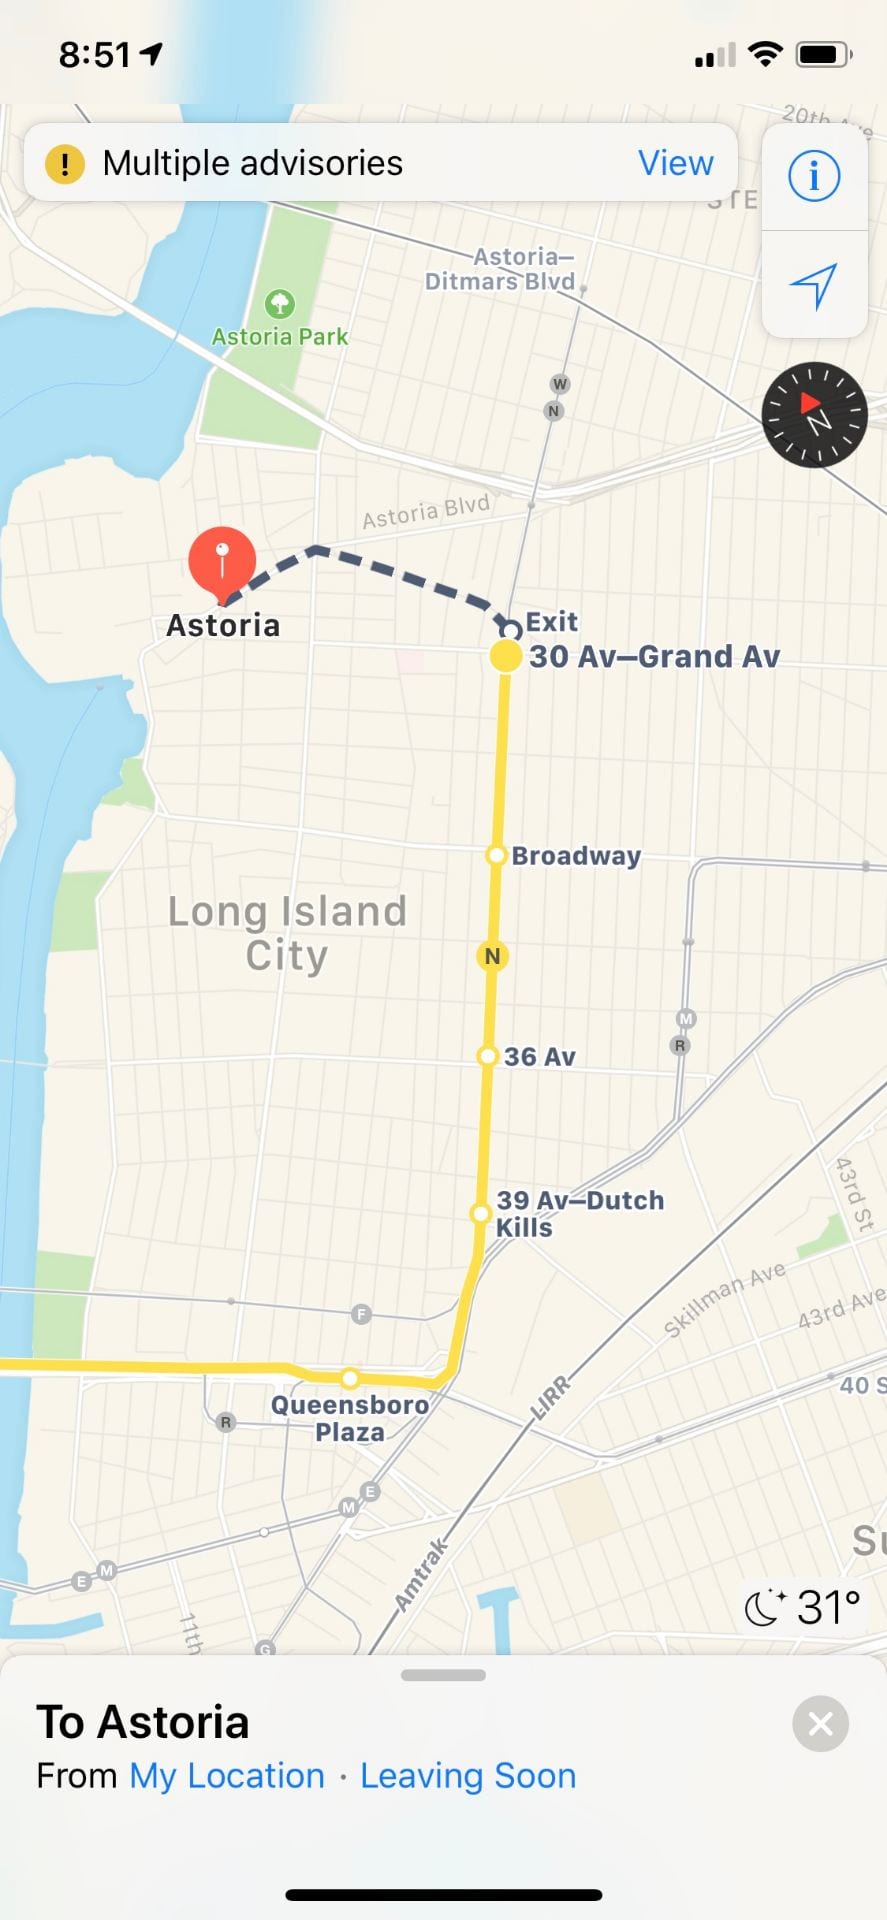
I added a map of the subway line you would use to reach Astoria. While it isn’t a straight line or ‘accurate’ map leading you directly to the neighborhood, it gives you a beginning and end destination, with the number of stops in between, so you don’t really need all the extra information, just the necessary things. I also created a pocket in which my phone would be placed inside and play the recording of Astoria that I took while on my visits there, to more engage the audience.
Reflection
I planned everything very carefully while I was working on this project and I feel it did not look as I had expected it to. I am alright with this because I do like how it turned out. I had trouble with how to present the information and it was because I was overthinking and making making the information too complex to be understood. I needed to take a step back and think about how to present the information in a clear manner while keeping the design interesting. I know I still have much to improve but I can see from this project what we are trying to learn in both Studio and Seminar.