Hello! I’m Lexi, a current communication design major interested in exploring graphic + data visualization, alongside typography and iconography, for global and humanitarian design purposes.
My final research project is a simulation of influence, in which viewers experience the boundaries corrupt political leaders hold over their audience in a series of coded visual graphics.
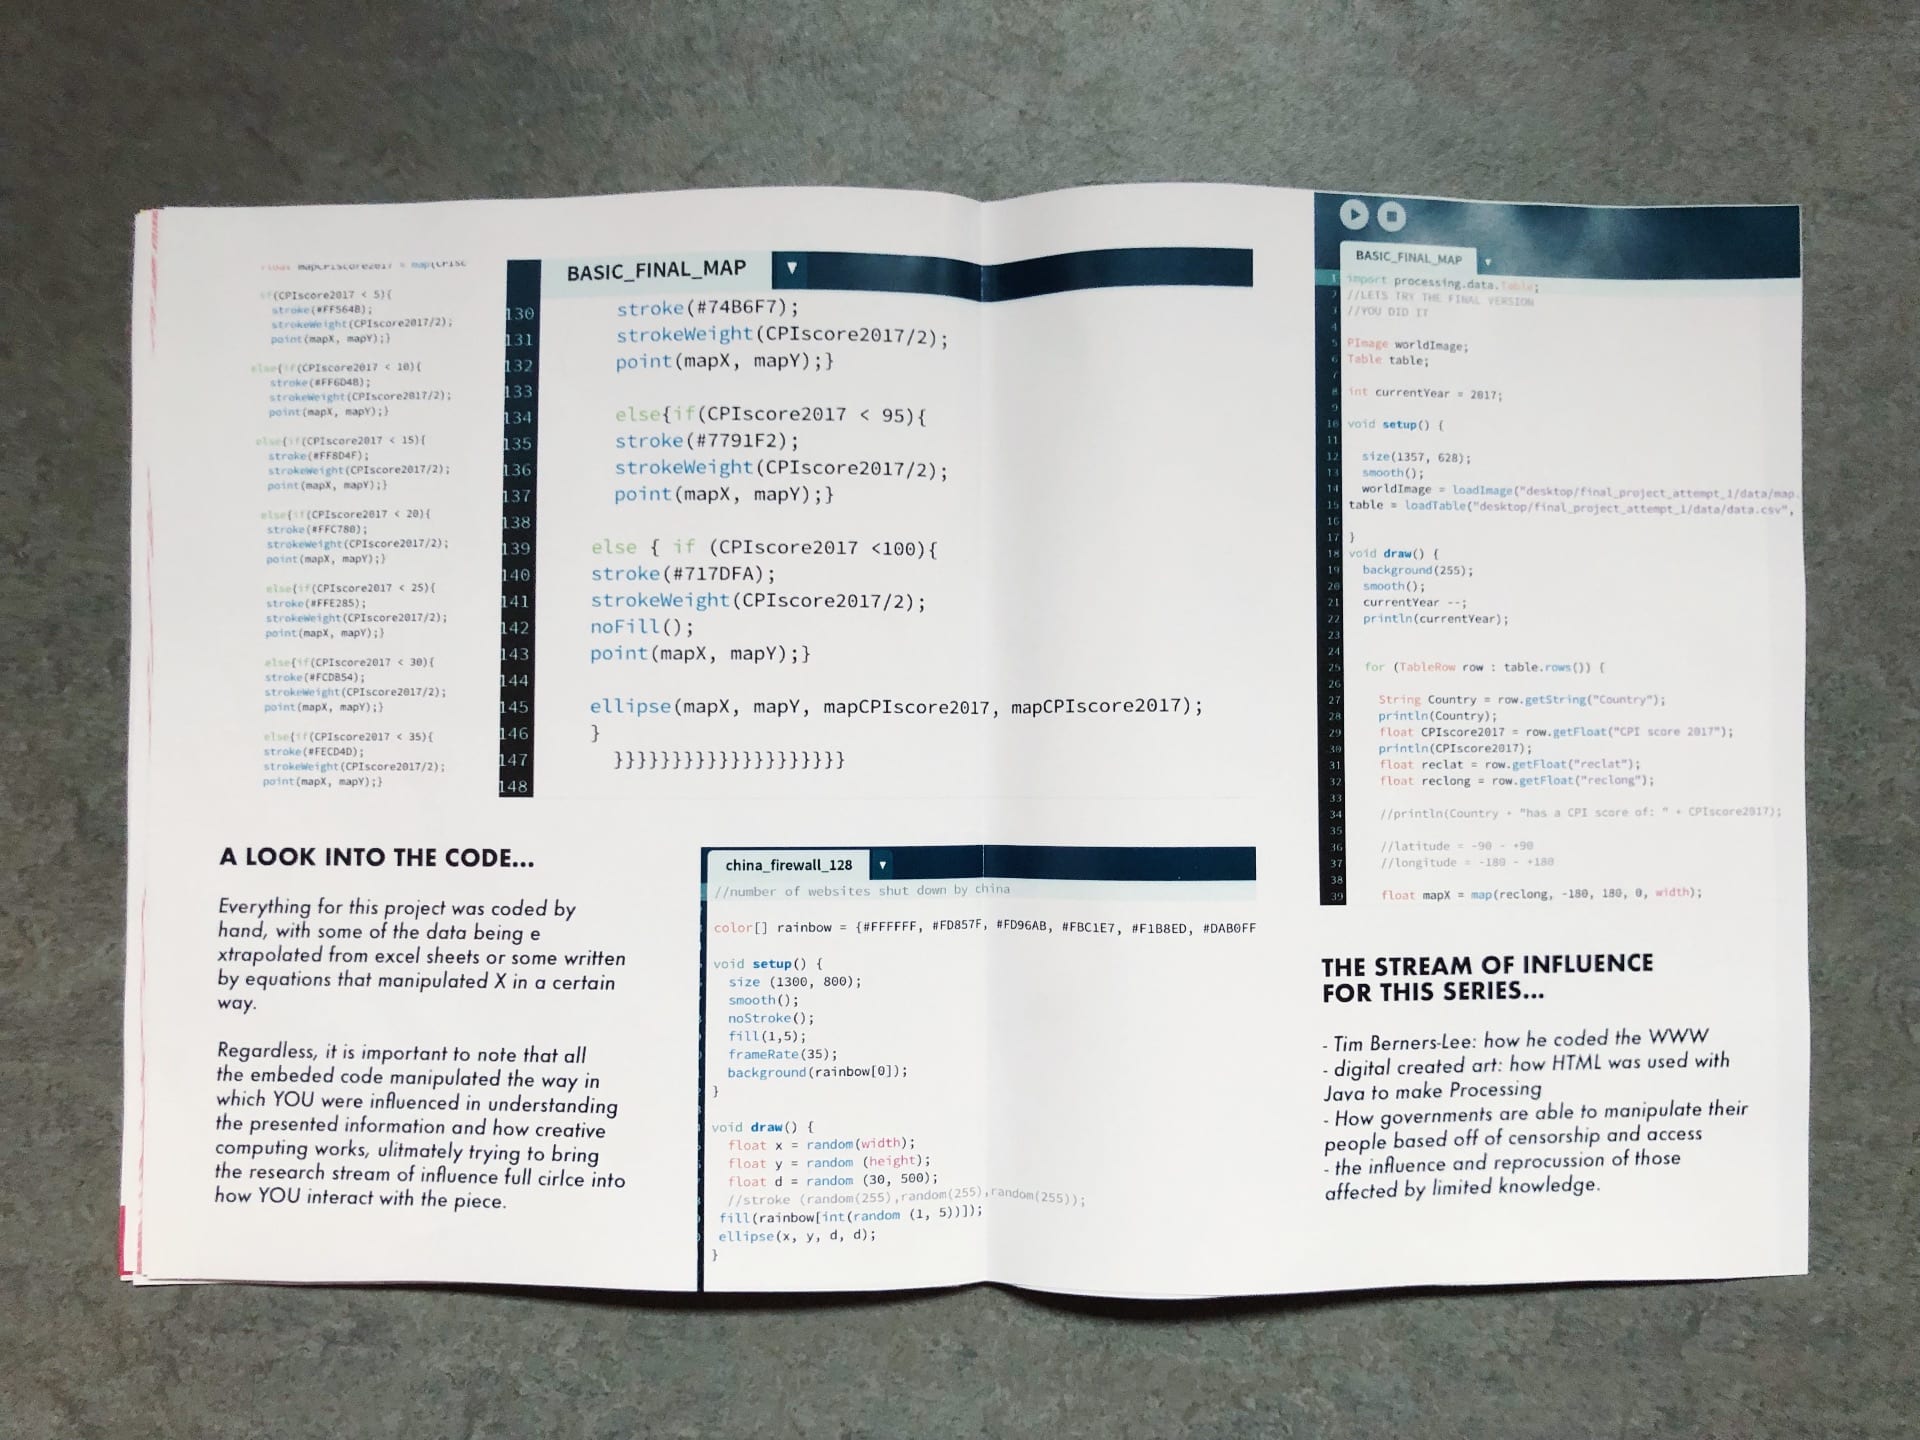
The project’s core drives back to understanding the influences of my chosen designer- Sir Tim Berner’s Lee. Berners-Lee was a developer who combined the domain name system, HyperText, and a few other online components that crafted the WWW. Thus, to fully understand this amalgamation of his, I felt the need to take basic HTML courses. Through Lynda.com, I completed a series on how to write and understand basic HTML, which led me to discover generative art. Generative, or coded, design work has manifested from the creation of the WWW by other software developers interested in protocols with visual results. A few to note are Ben Fry and Casey Raes. These developers took the same approach Berners-Lee did, in that they created an open source program by combining the technology/innovation from Java, C, PostScript, and Logo. Their result ended up being the program Processing, which after additional research and Lynda courses, influenced me as my medium for my work.
final outcomes:

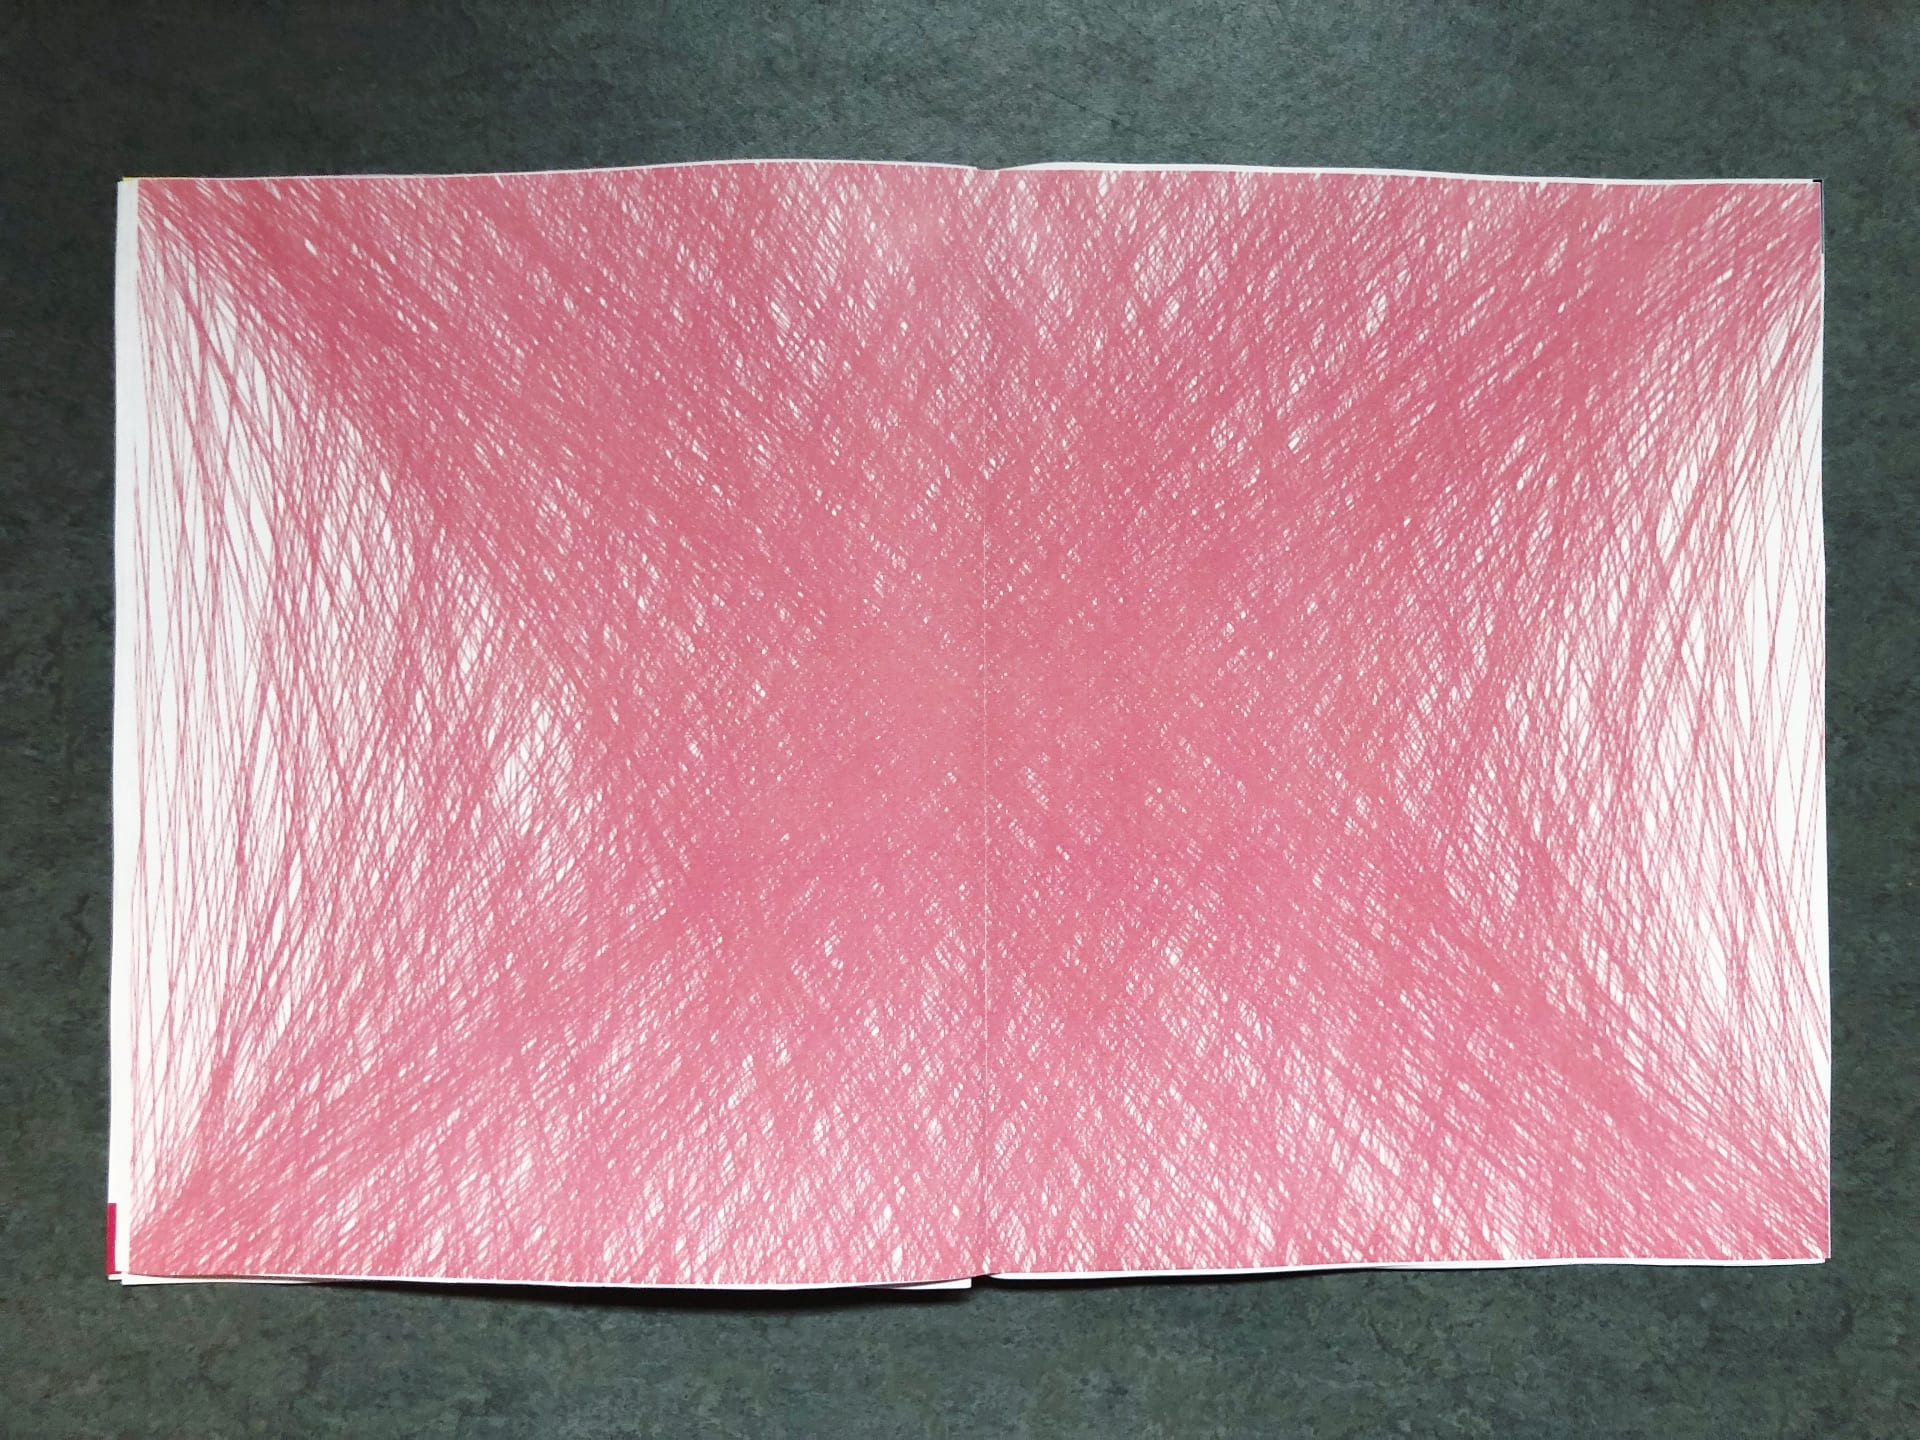
“30.9 million” from The Corruption of China: A Look Into the Great Firewall. This piece illustrates the number of publications confiscated by China in 2017 using coded pixels. However, I chose to make the differentiation visible between each pixel, thus the portrait would need to be 267.6 times smaller to be accurate of 30.9 million.


“128k” from The Corruption of China: A Look Into the Great Firewall. This work is a live-action video, with 35 new coded circles appearing per second. Each circle represents a website blocked by China due to “harmful or obscene information” against the government. This video would need to be viewed from 60.9 minutes to fully experience the number of websites blocked in 2017 alone.
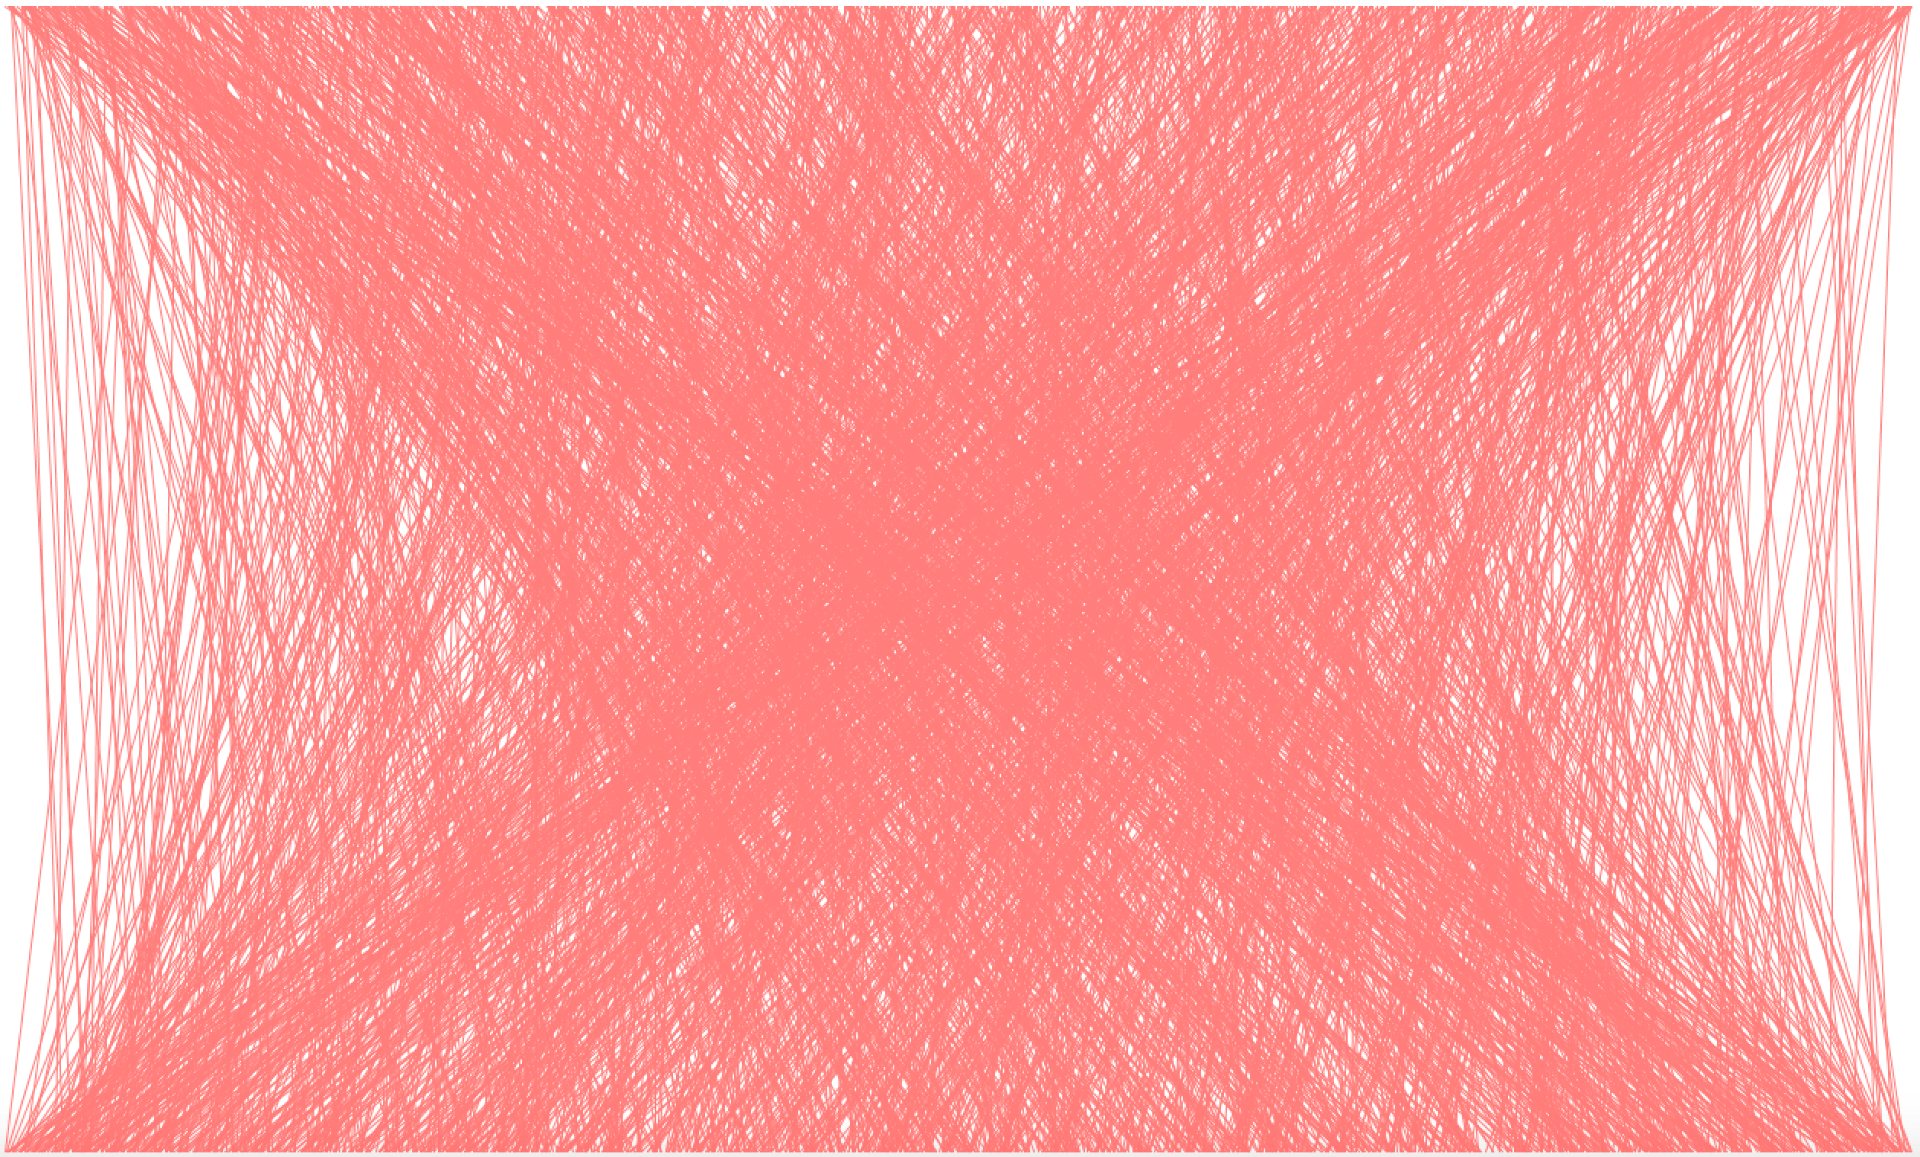
“1900 Criminals” from The Corruption of China: A Look Into the Great Firewall. This piece maps out the lives of the 1900 individuals in 2017 who suffered criminal penalties for breaking WWW and internet restrictions.
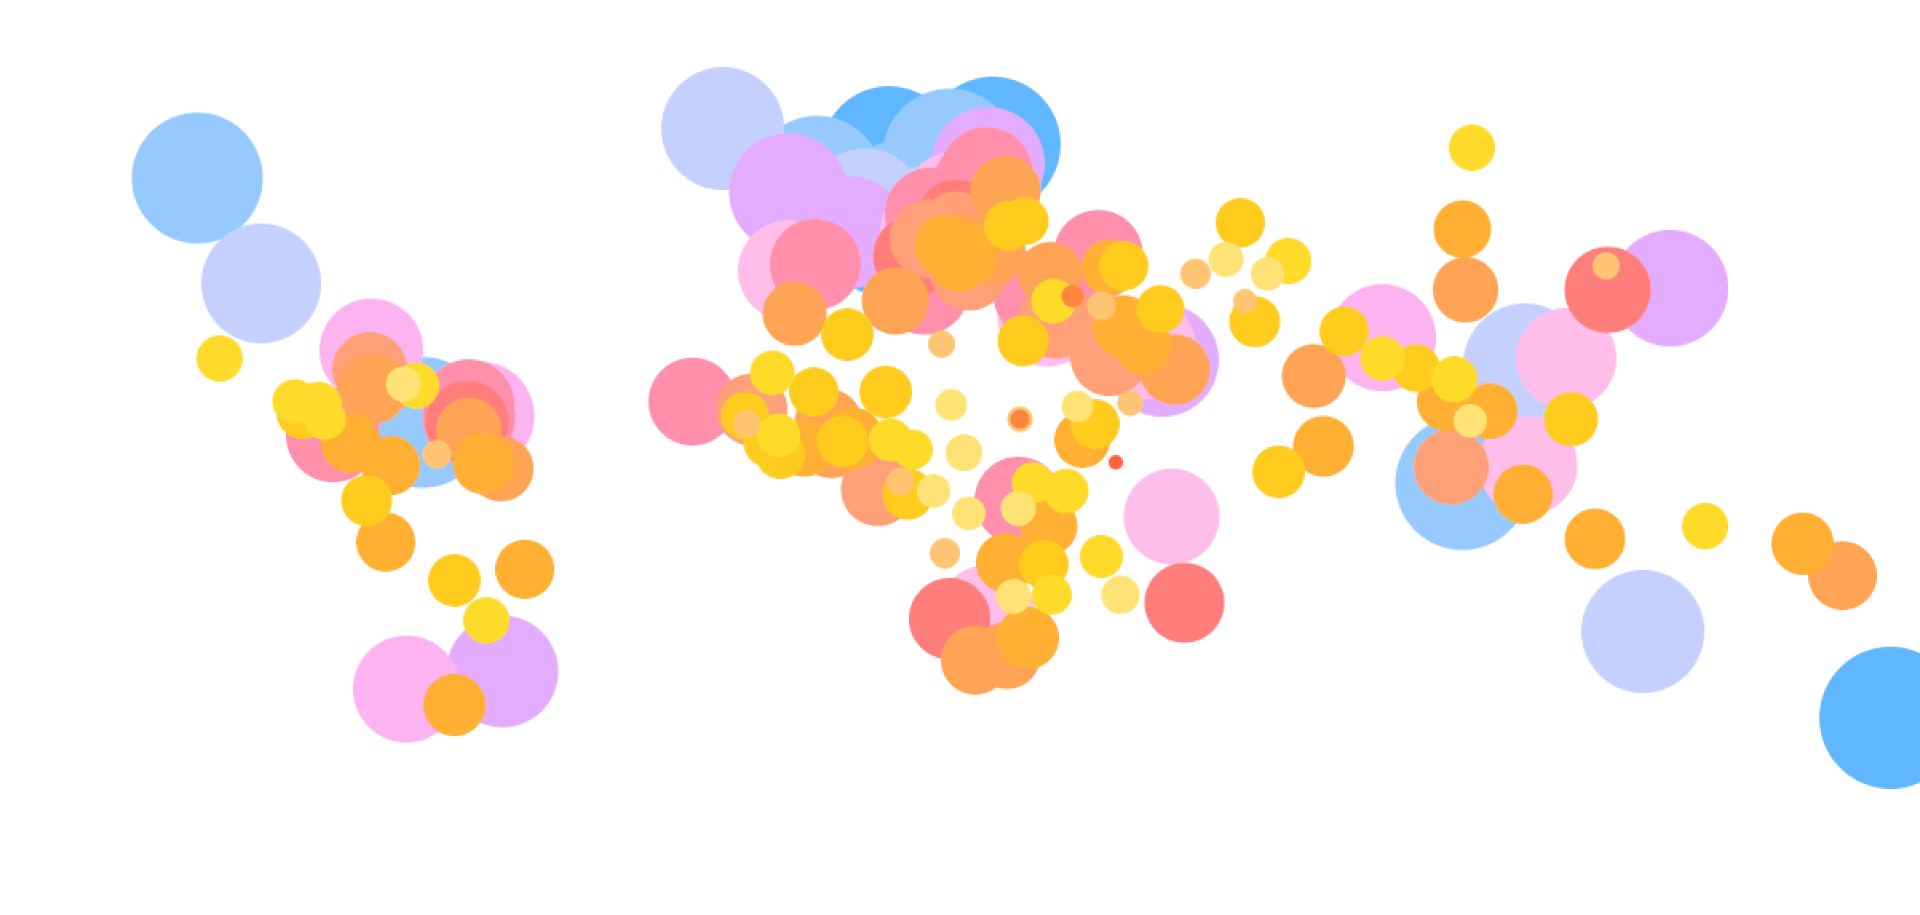
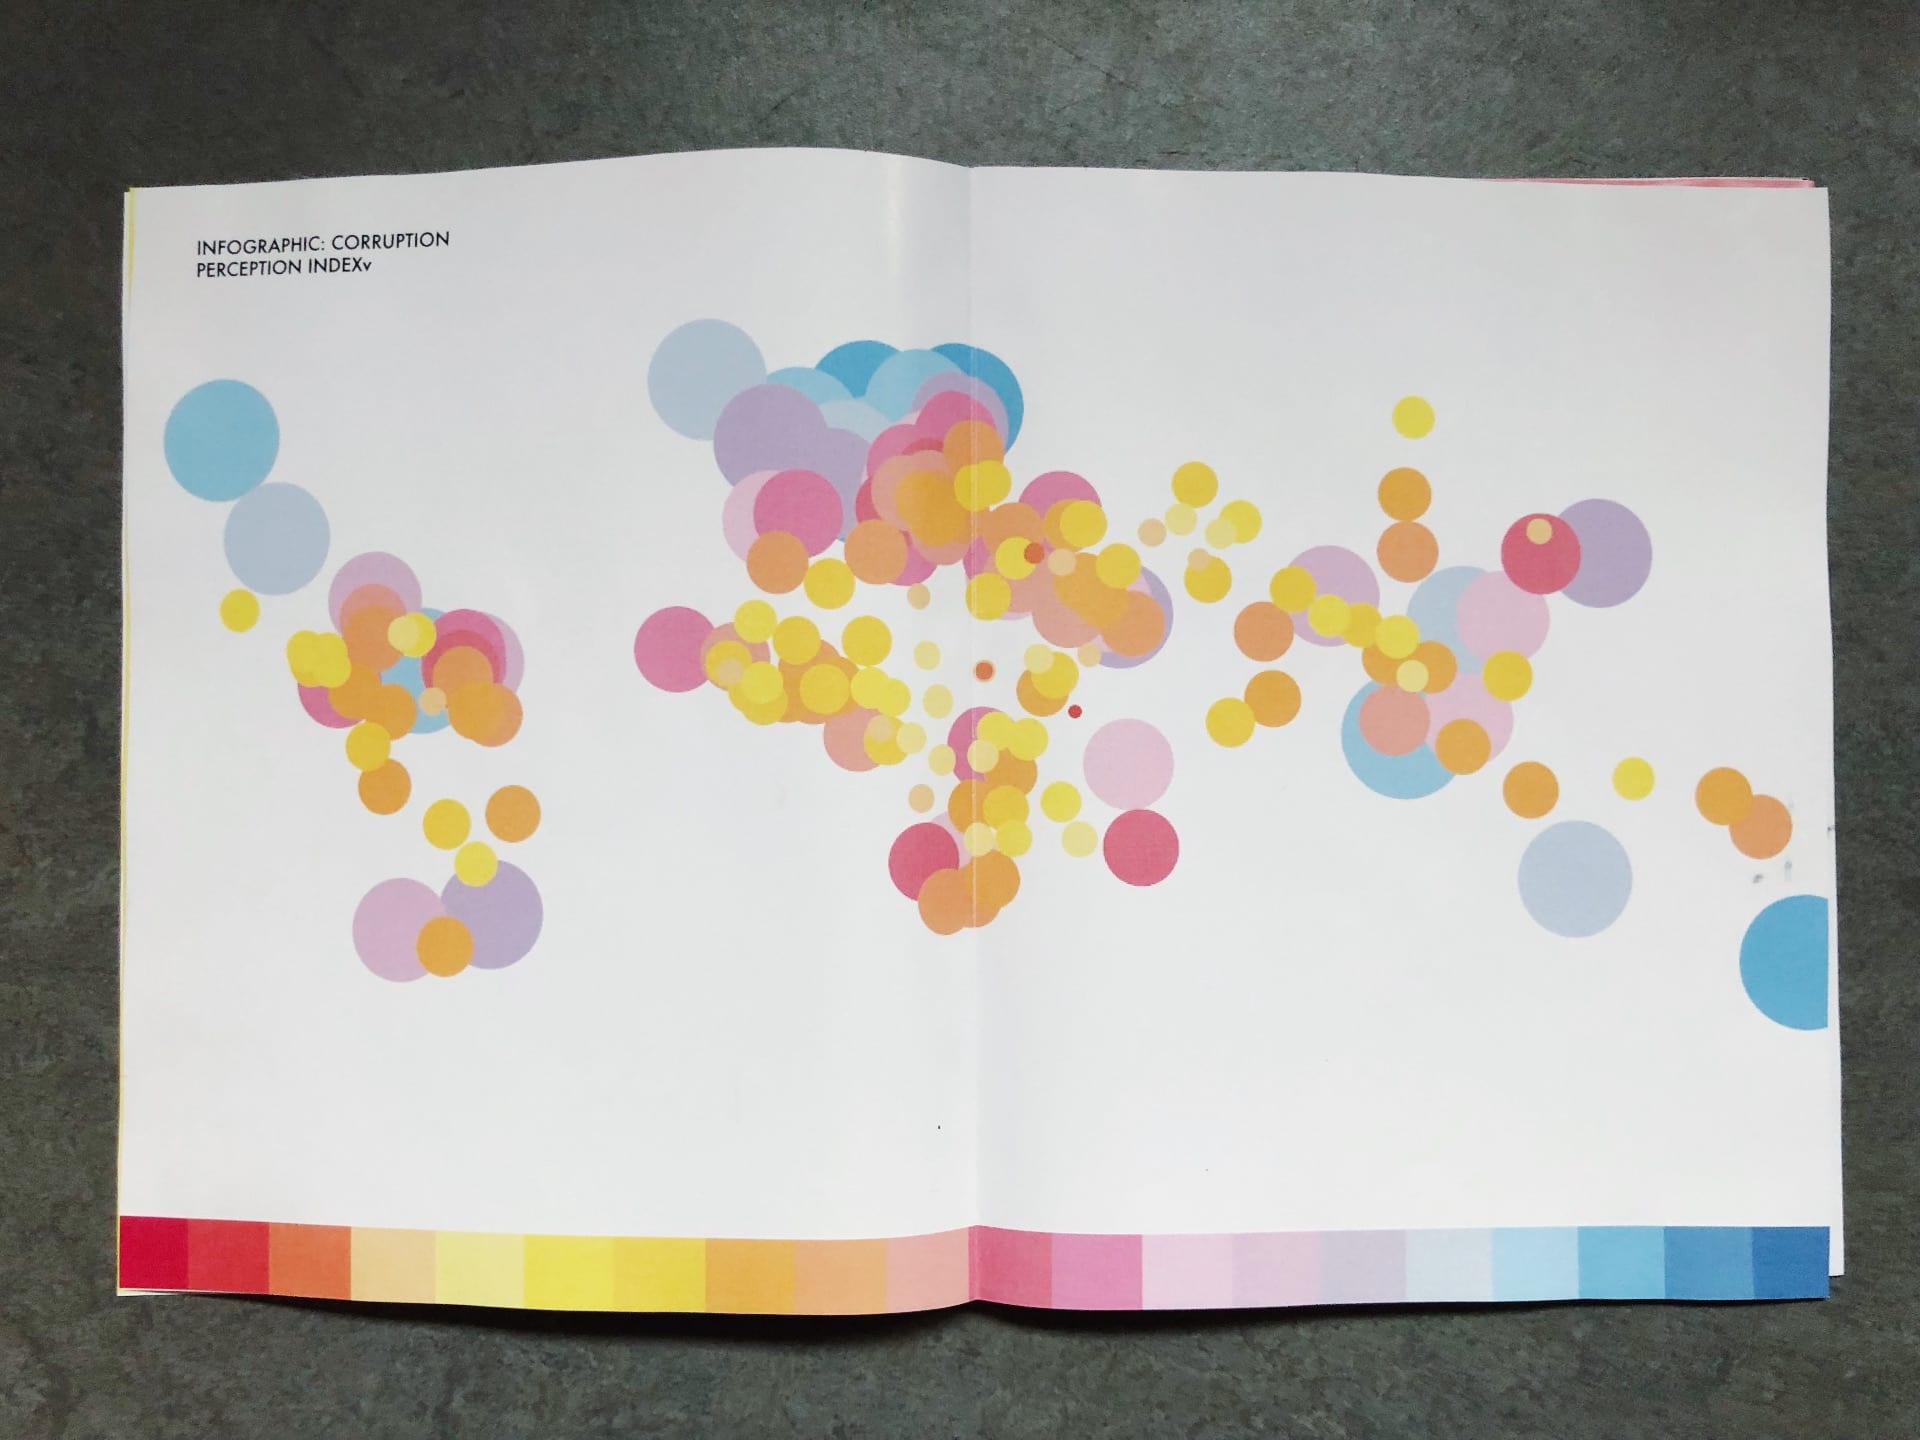
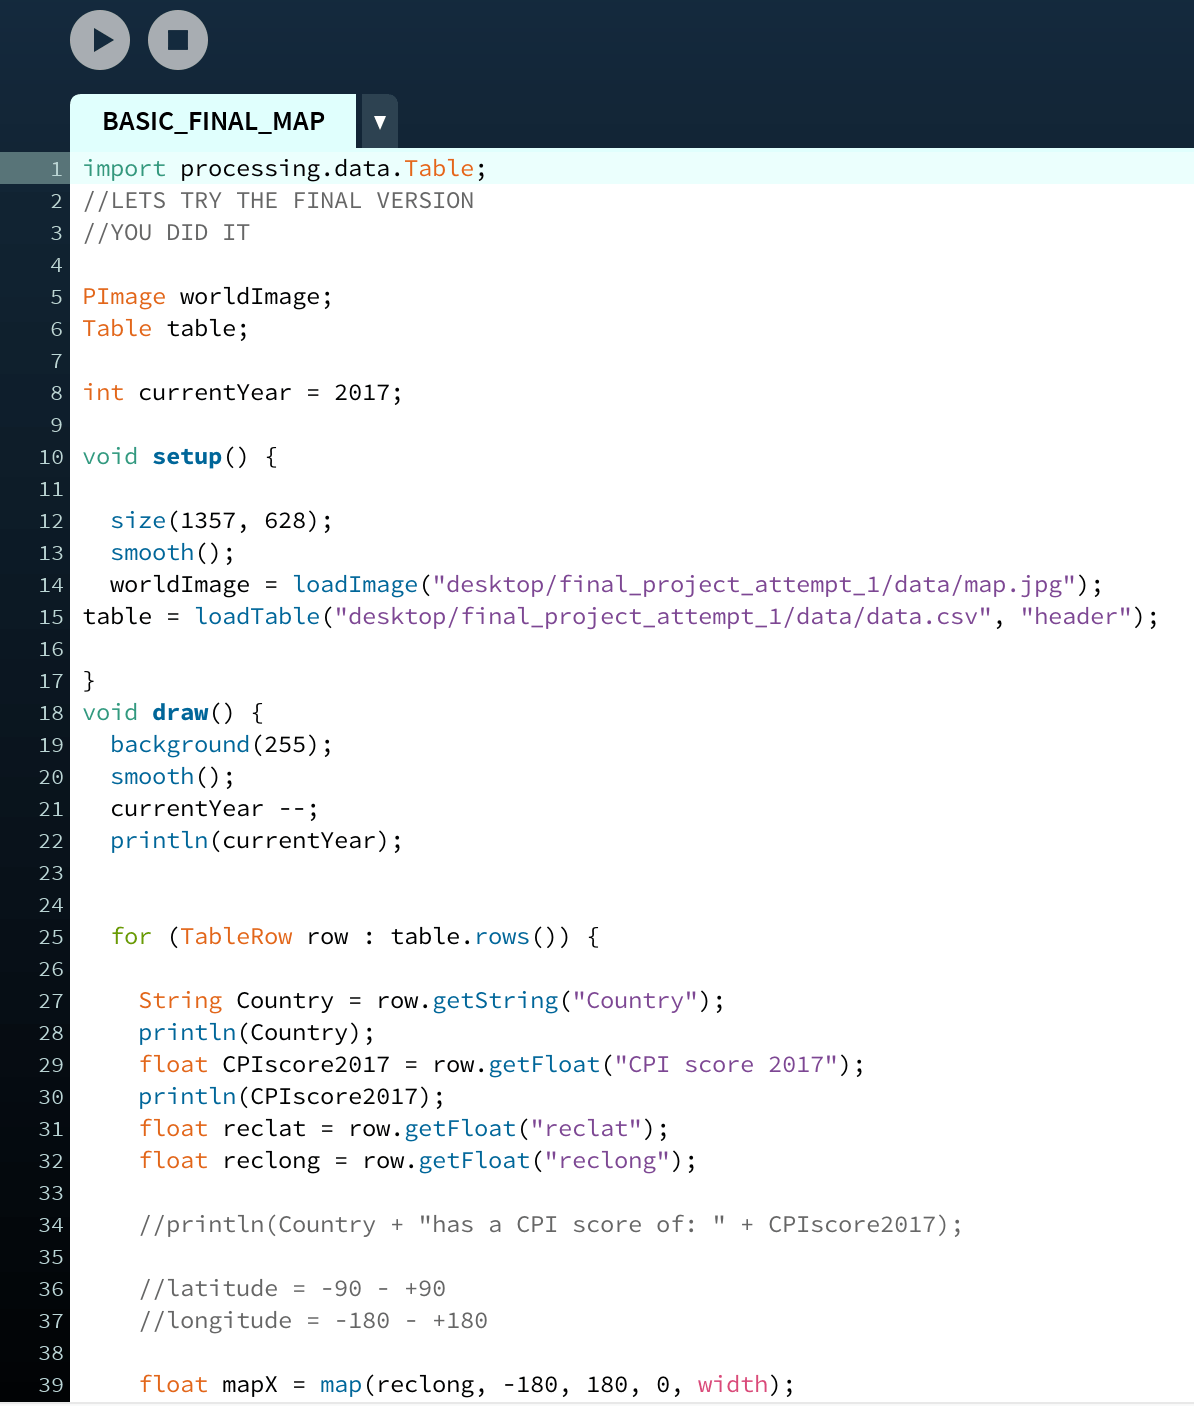
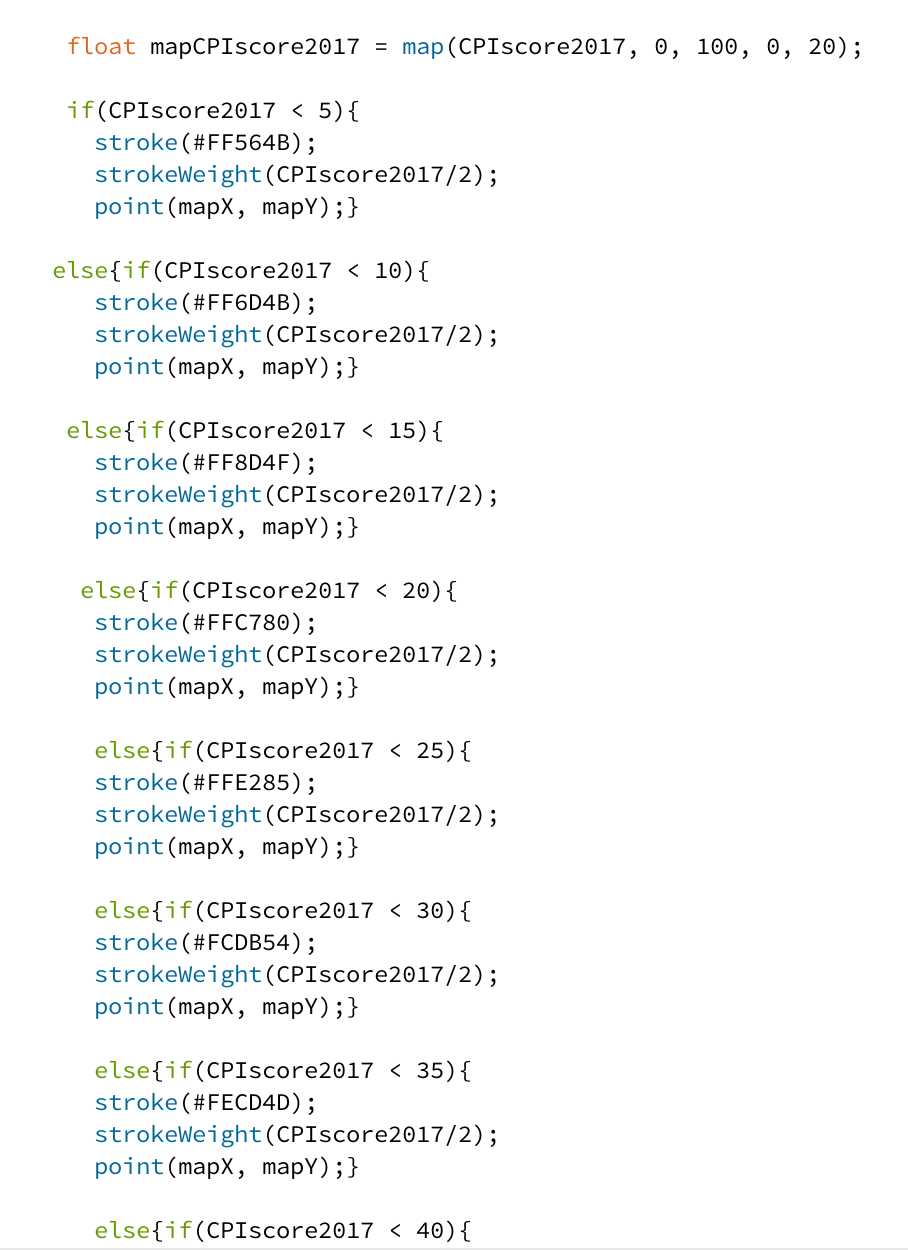
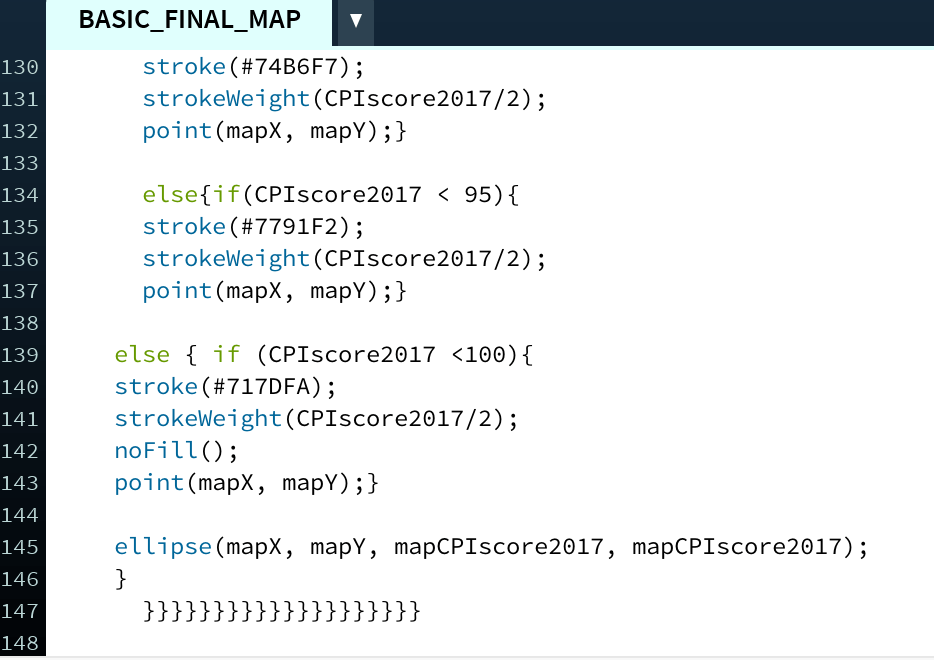
“Corruption Perception Index (CPI) Map,” a precursor into my works from the series The Corruption of China: A Look Into the Great Firewall. This map collected data used from Transparency International, an organization that rates countries on various aspects of freedom and corruption, with open access to the WWW being key. For this image, I extracted the data and coded a map color coordinating ranges of the CPI Index scale (0-100), the blues being the best, least corrupt, and the reds the opposite. I then further coded the map on a 3D plane so it could be further experienced beyond the planar field.
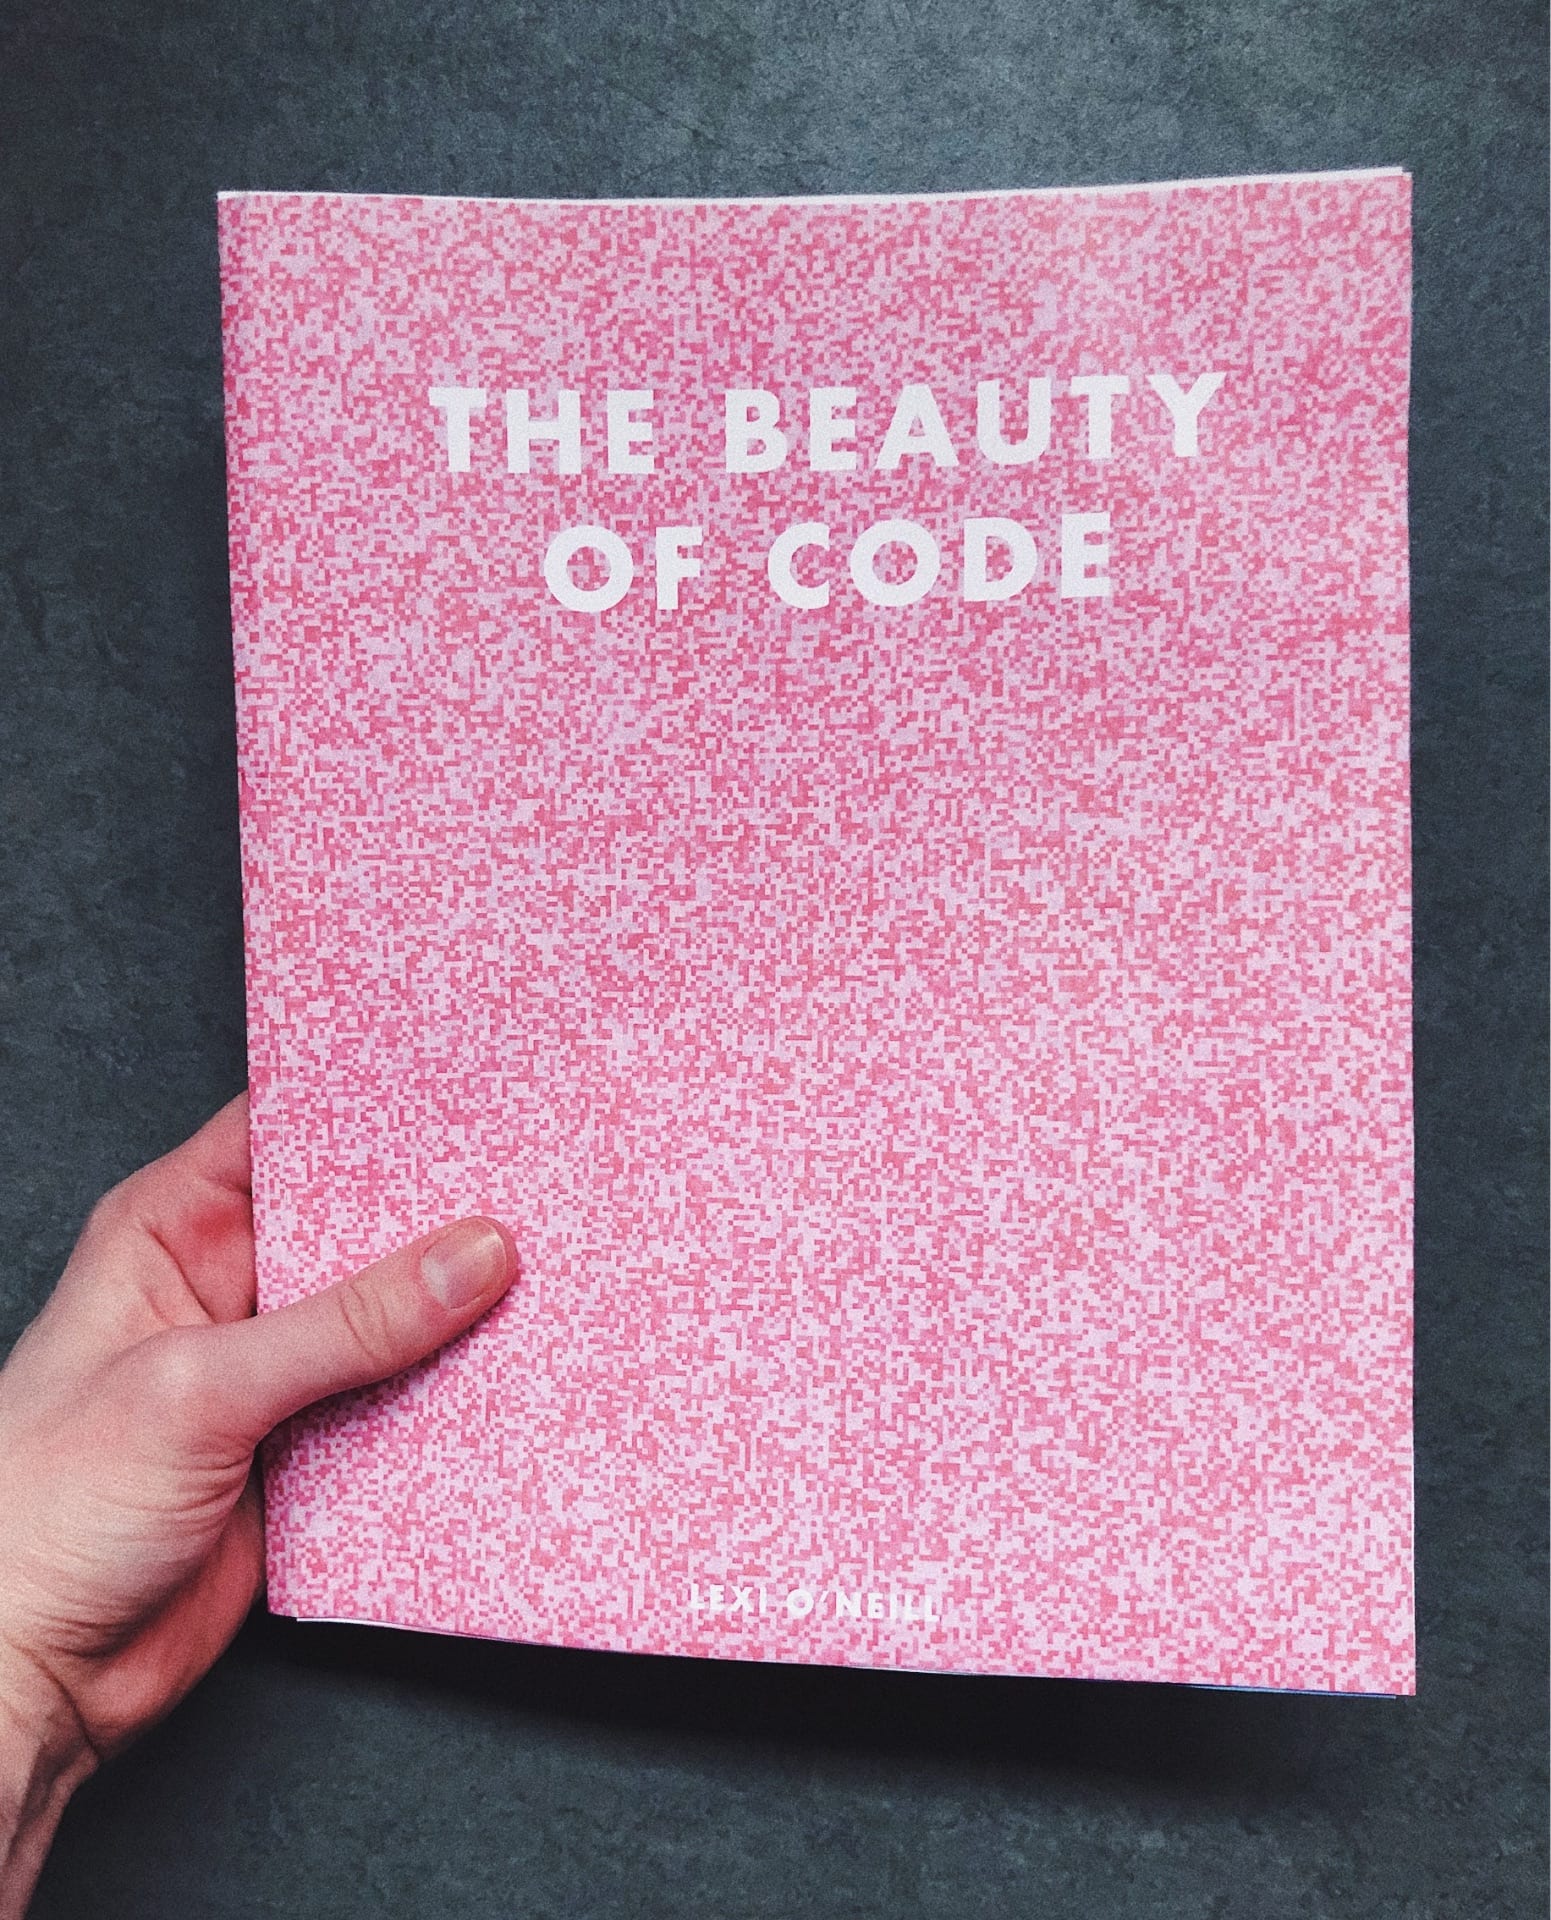
zine of still images/research: outcome:

Thought process:
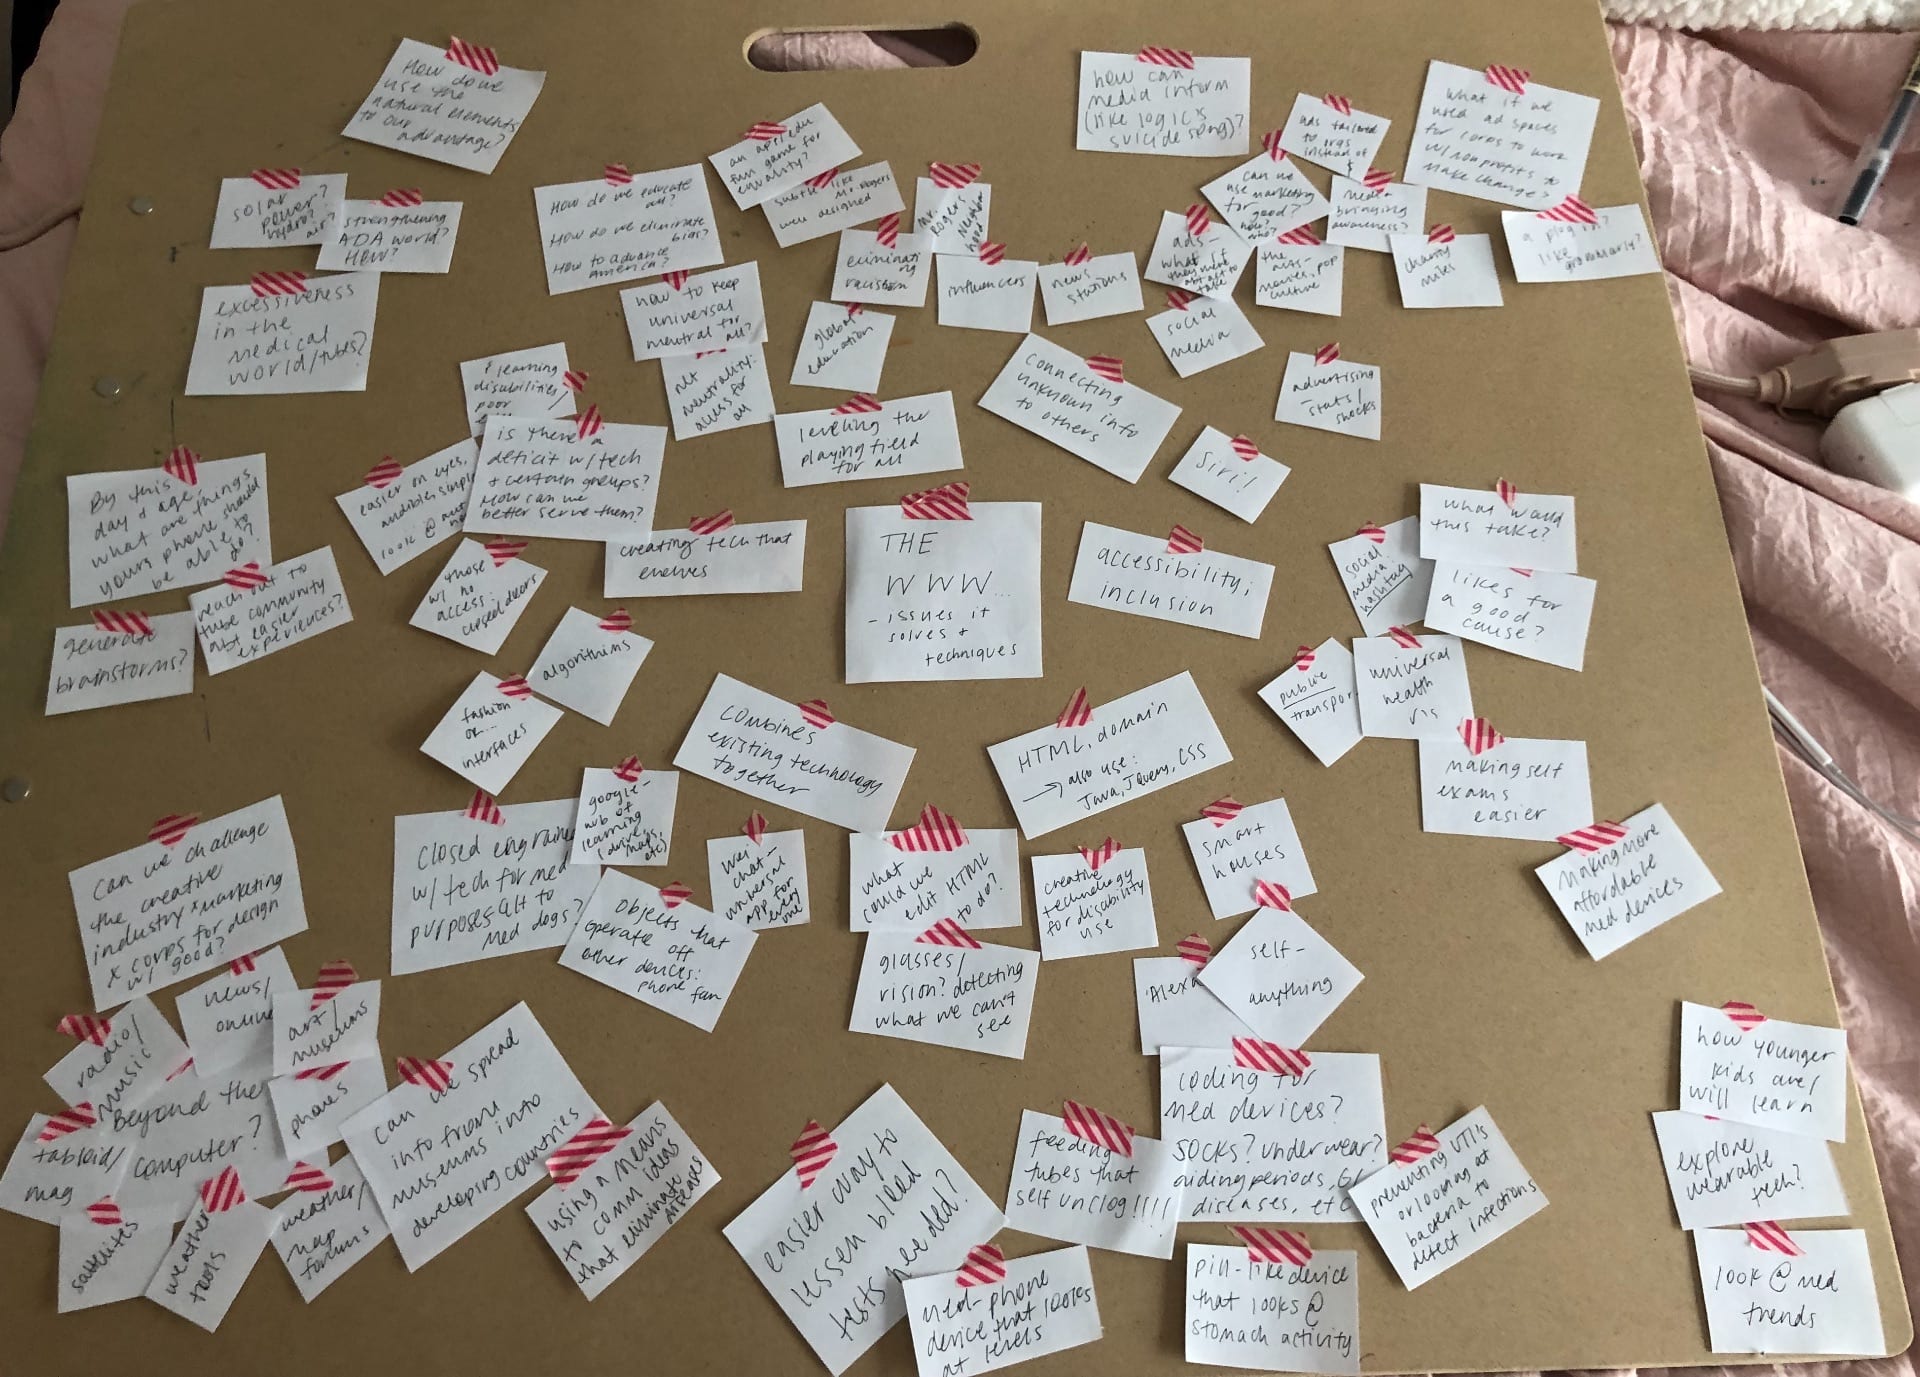

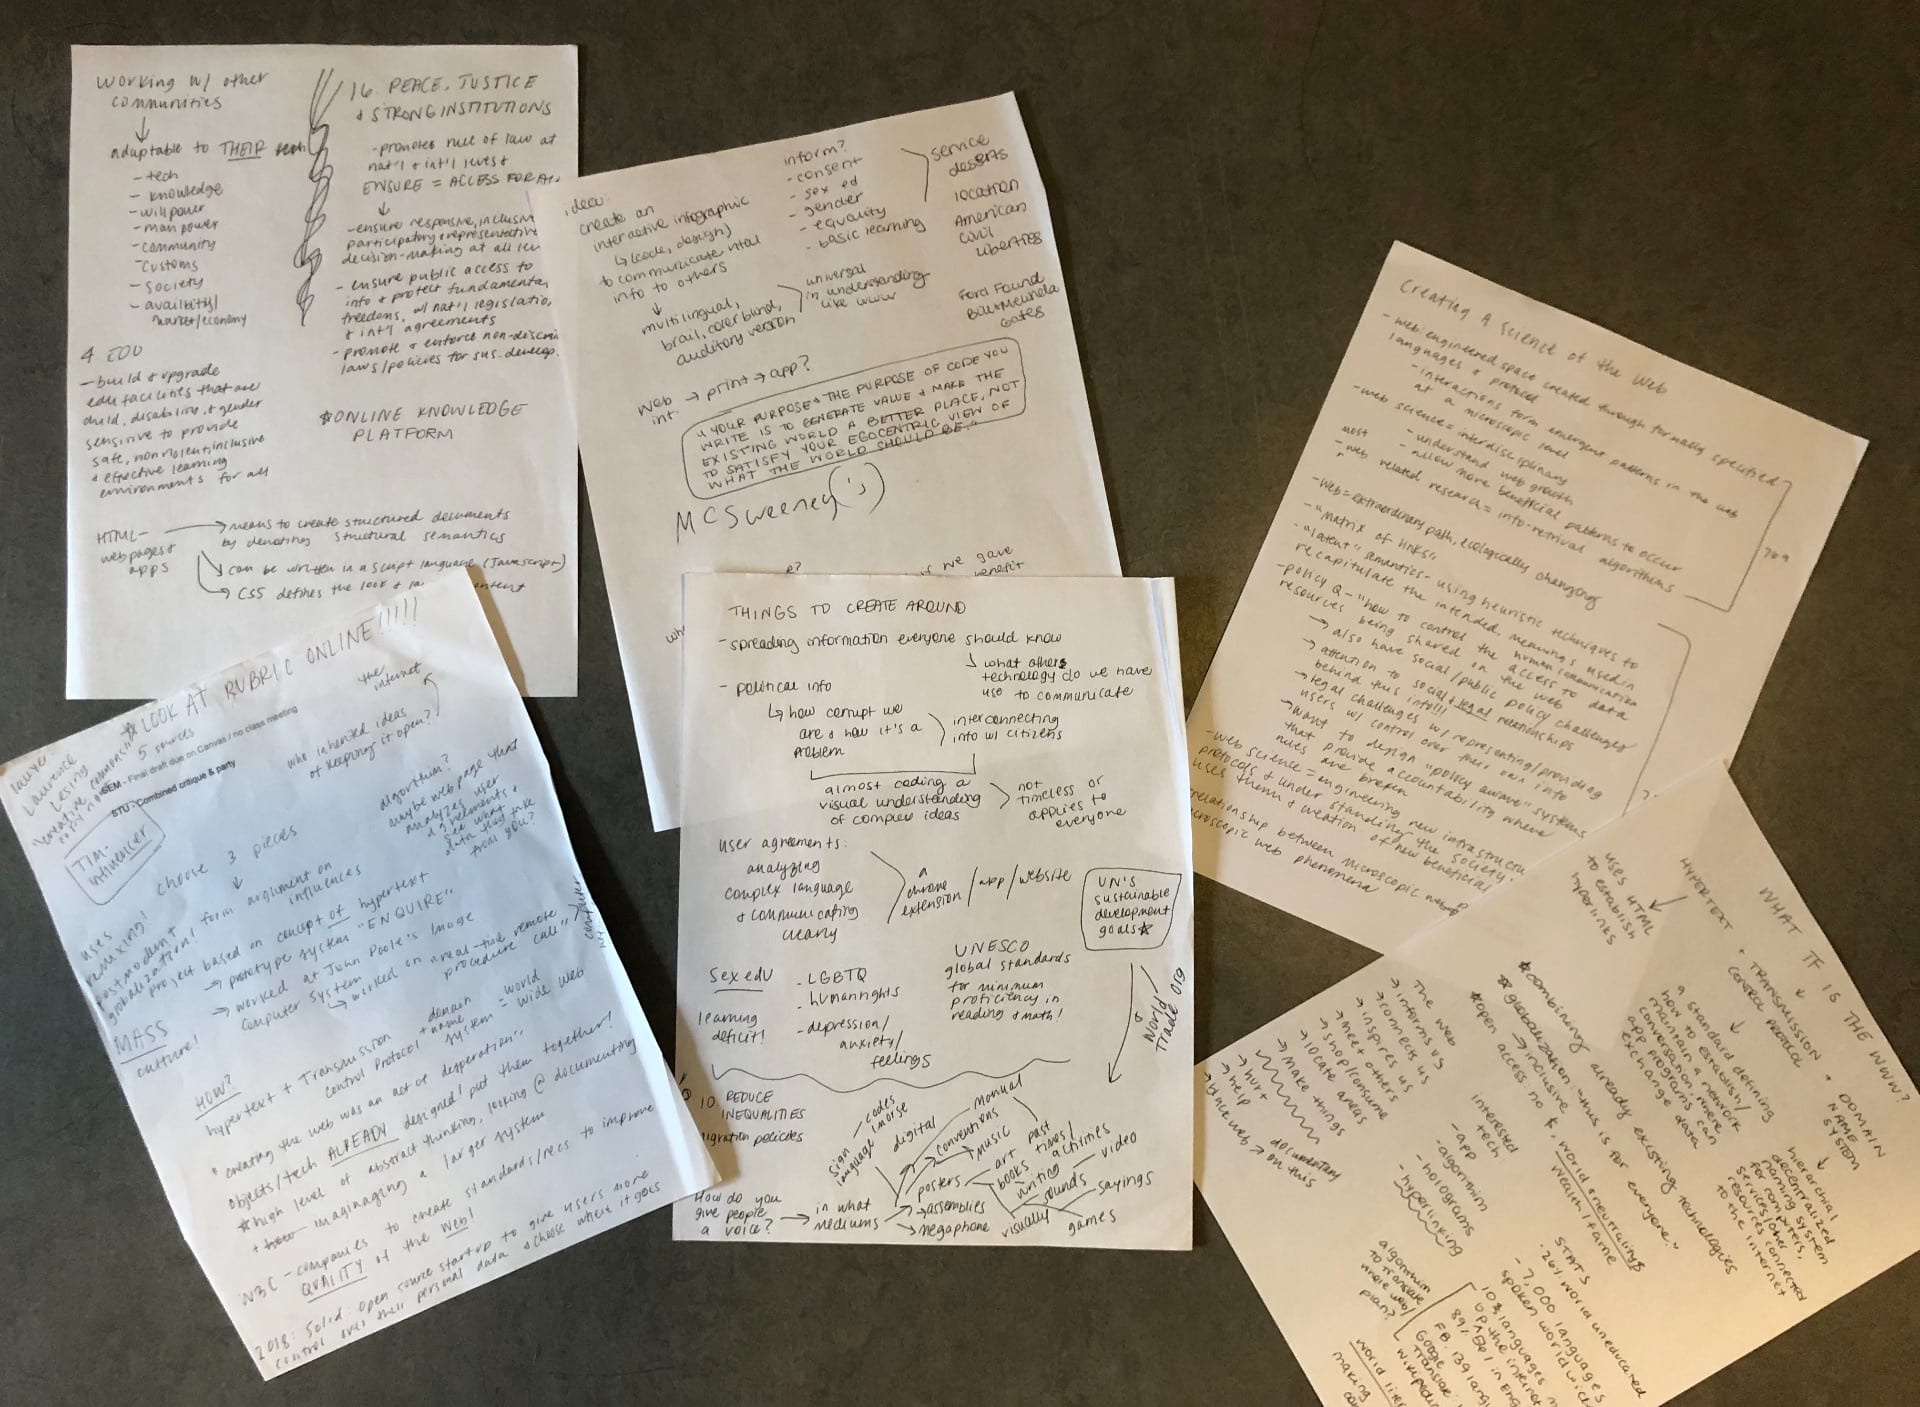
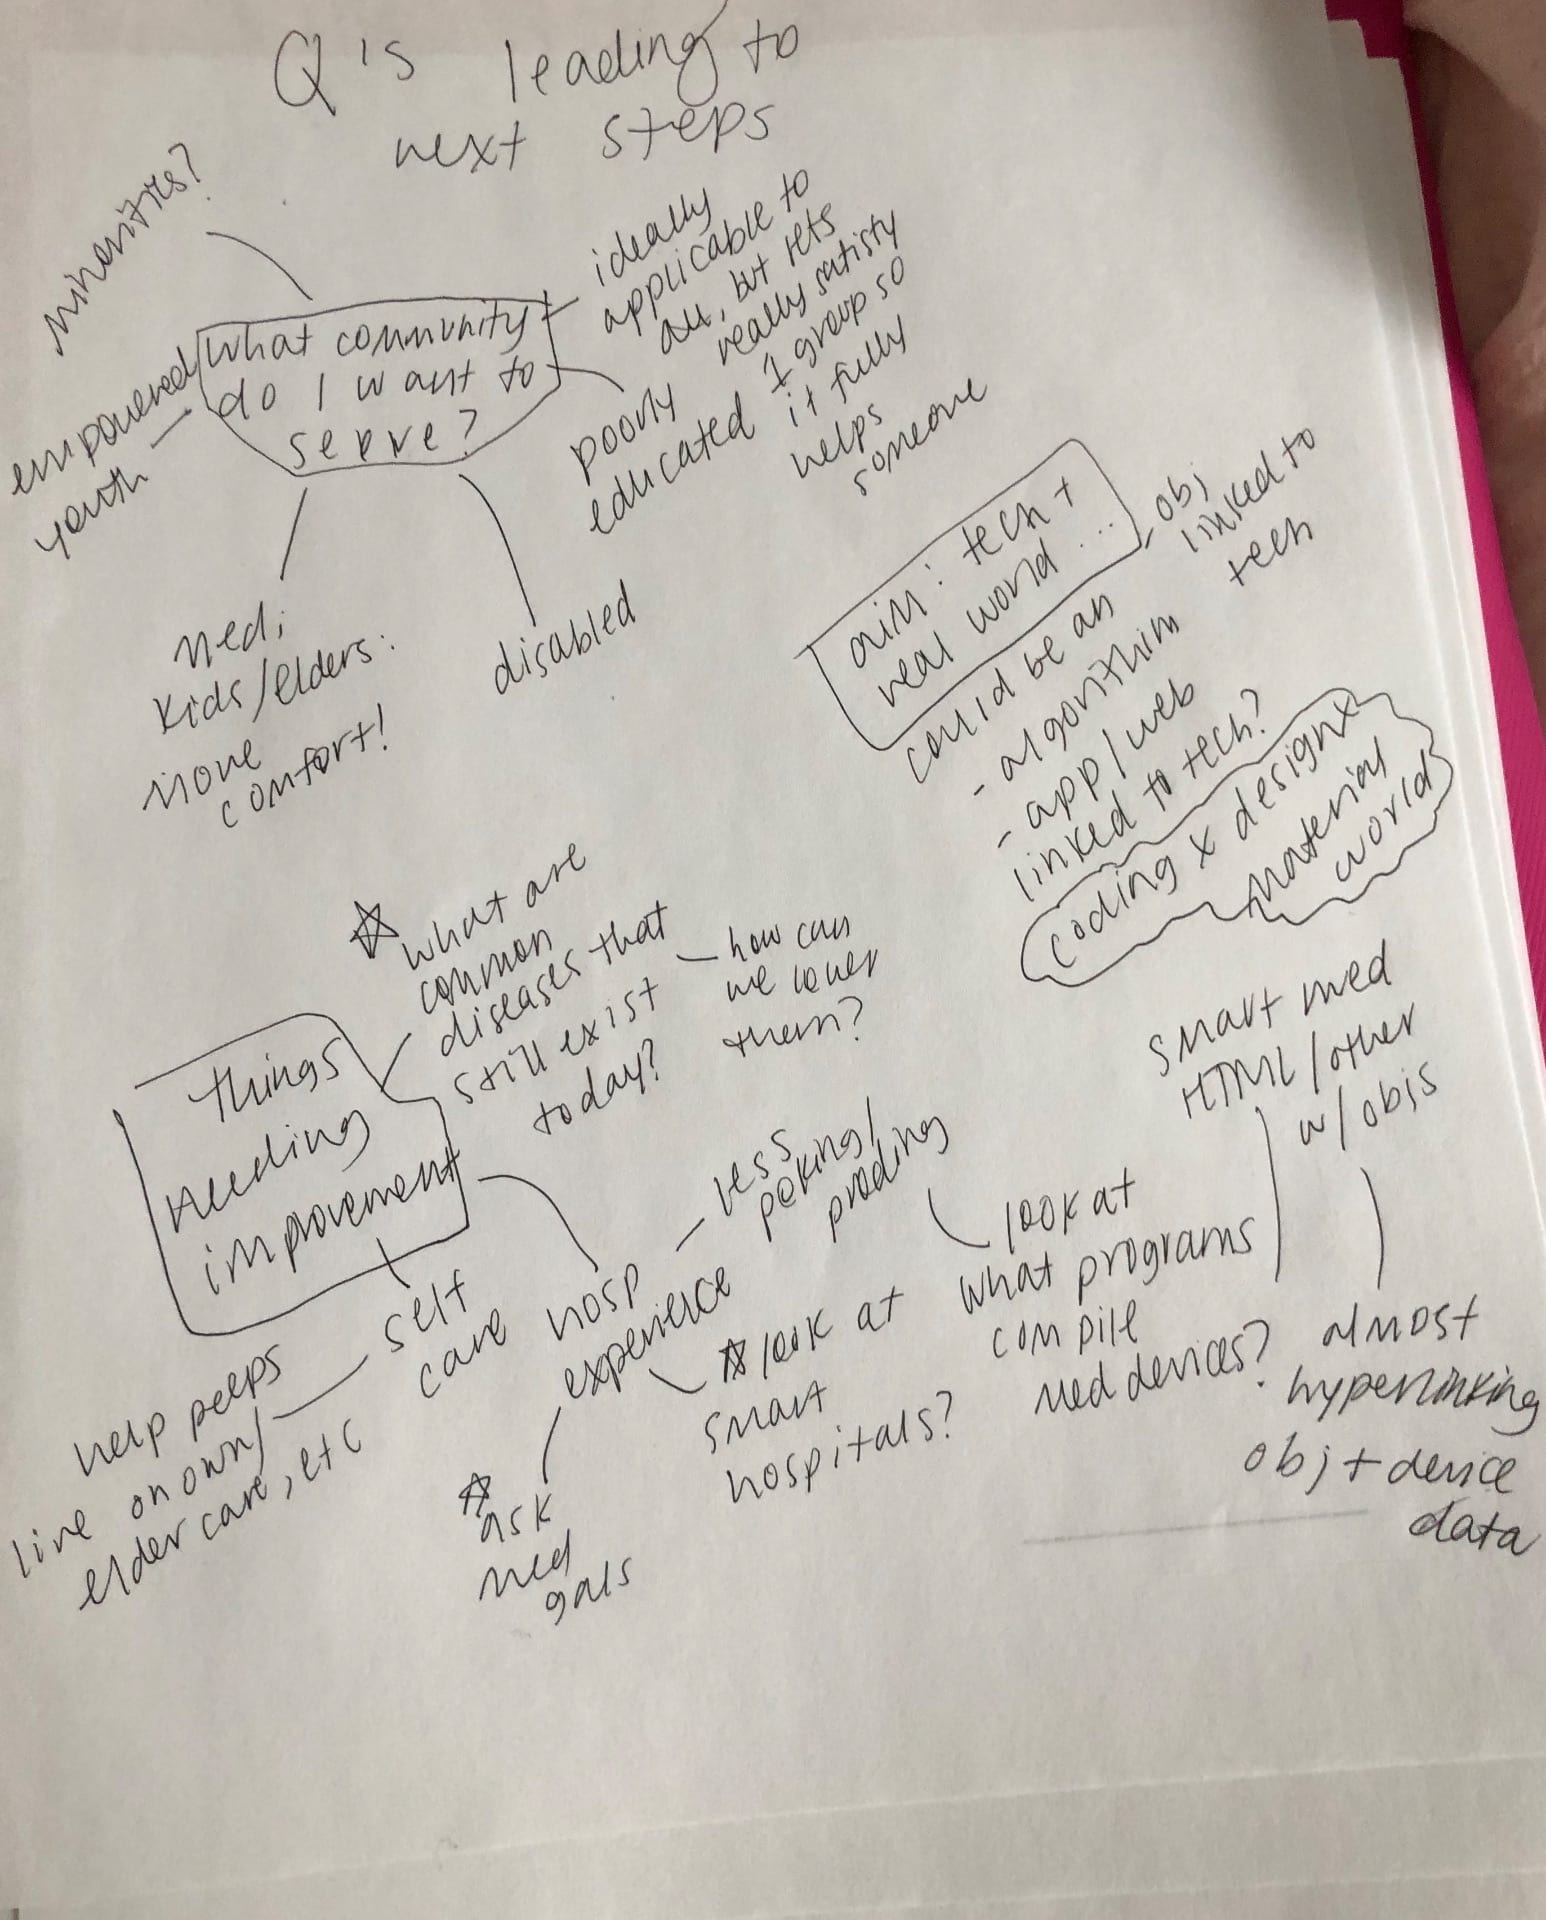

Exploring and responding to this project prompt took an extensive amount of research and thinking, as the direction I wanted to head in changed multiple times. Originally, I wanted to code something for people, but I found that I was pushing to make something just to make it, not to create something based on the innovation and inspiration that Berners-Lee had. Throughout my research process regarding Lynda courses and web mapping, I came to unravel a new medium; generative art, which became my inspiration source and medium for a project displaying how visually and structurally global WWW restrictions work.
Personally, I really enjoyed this project and the level of thinking/discovery of new skills that accompanied it. I have unmasked a new medium I would further like to explore and a new subject matter that I am now considering into shifting my major at college around. I really learned how to let research guide me, and more specifically, how hard I could push myself conceptually. In exploring this topic matter, I have become interested in data visualization and development, which I am now looking into as a skill I want to implement in my career as a designer. I also think I want to use the framework from this project and its root cause to extracting pertinent data unknown to many, to inform others in a visual and memorable way. All of my work I want to create stems from the idea of creating one of a few things; work that makes others happy, work that informs other and stimulates/evokes change and innovation towards good causes.