Description/justification our your poster conclusion:
For the final poster, our group changed the color scheme from navy blue and green to just different types of blue. This was inspired by the various logos found on the Coalition for the Homeless webpage – which was an organization that we contacted for our fieldwork research, providing us with a lot of data that we ultimately used on the poster. The change of colors also effectively made the text more legible as our new dark blue and light blue background poses visible contrast. Originally, the text was layered on top of a brown bottle of alcohol, which was difficult to identify on print seeing as the color did not show up the way we hoped it would. Thus, we removed the bottle after receiving feedback from the class because most people could not understand what it was, creating a distraction. On the other hand, after removing the bottle we lost the icon that represented substance abuse. To compensate for this we inserted a simple icon to represent homelessness (vector art of a beggar bent on their knees with a pail in front of them).
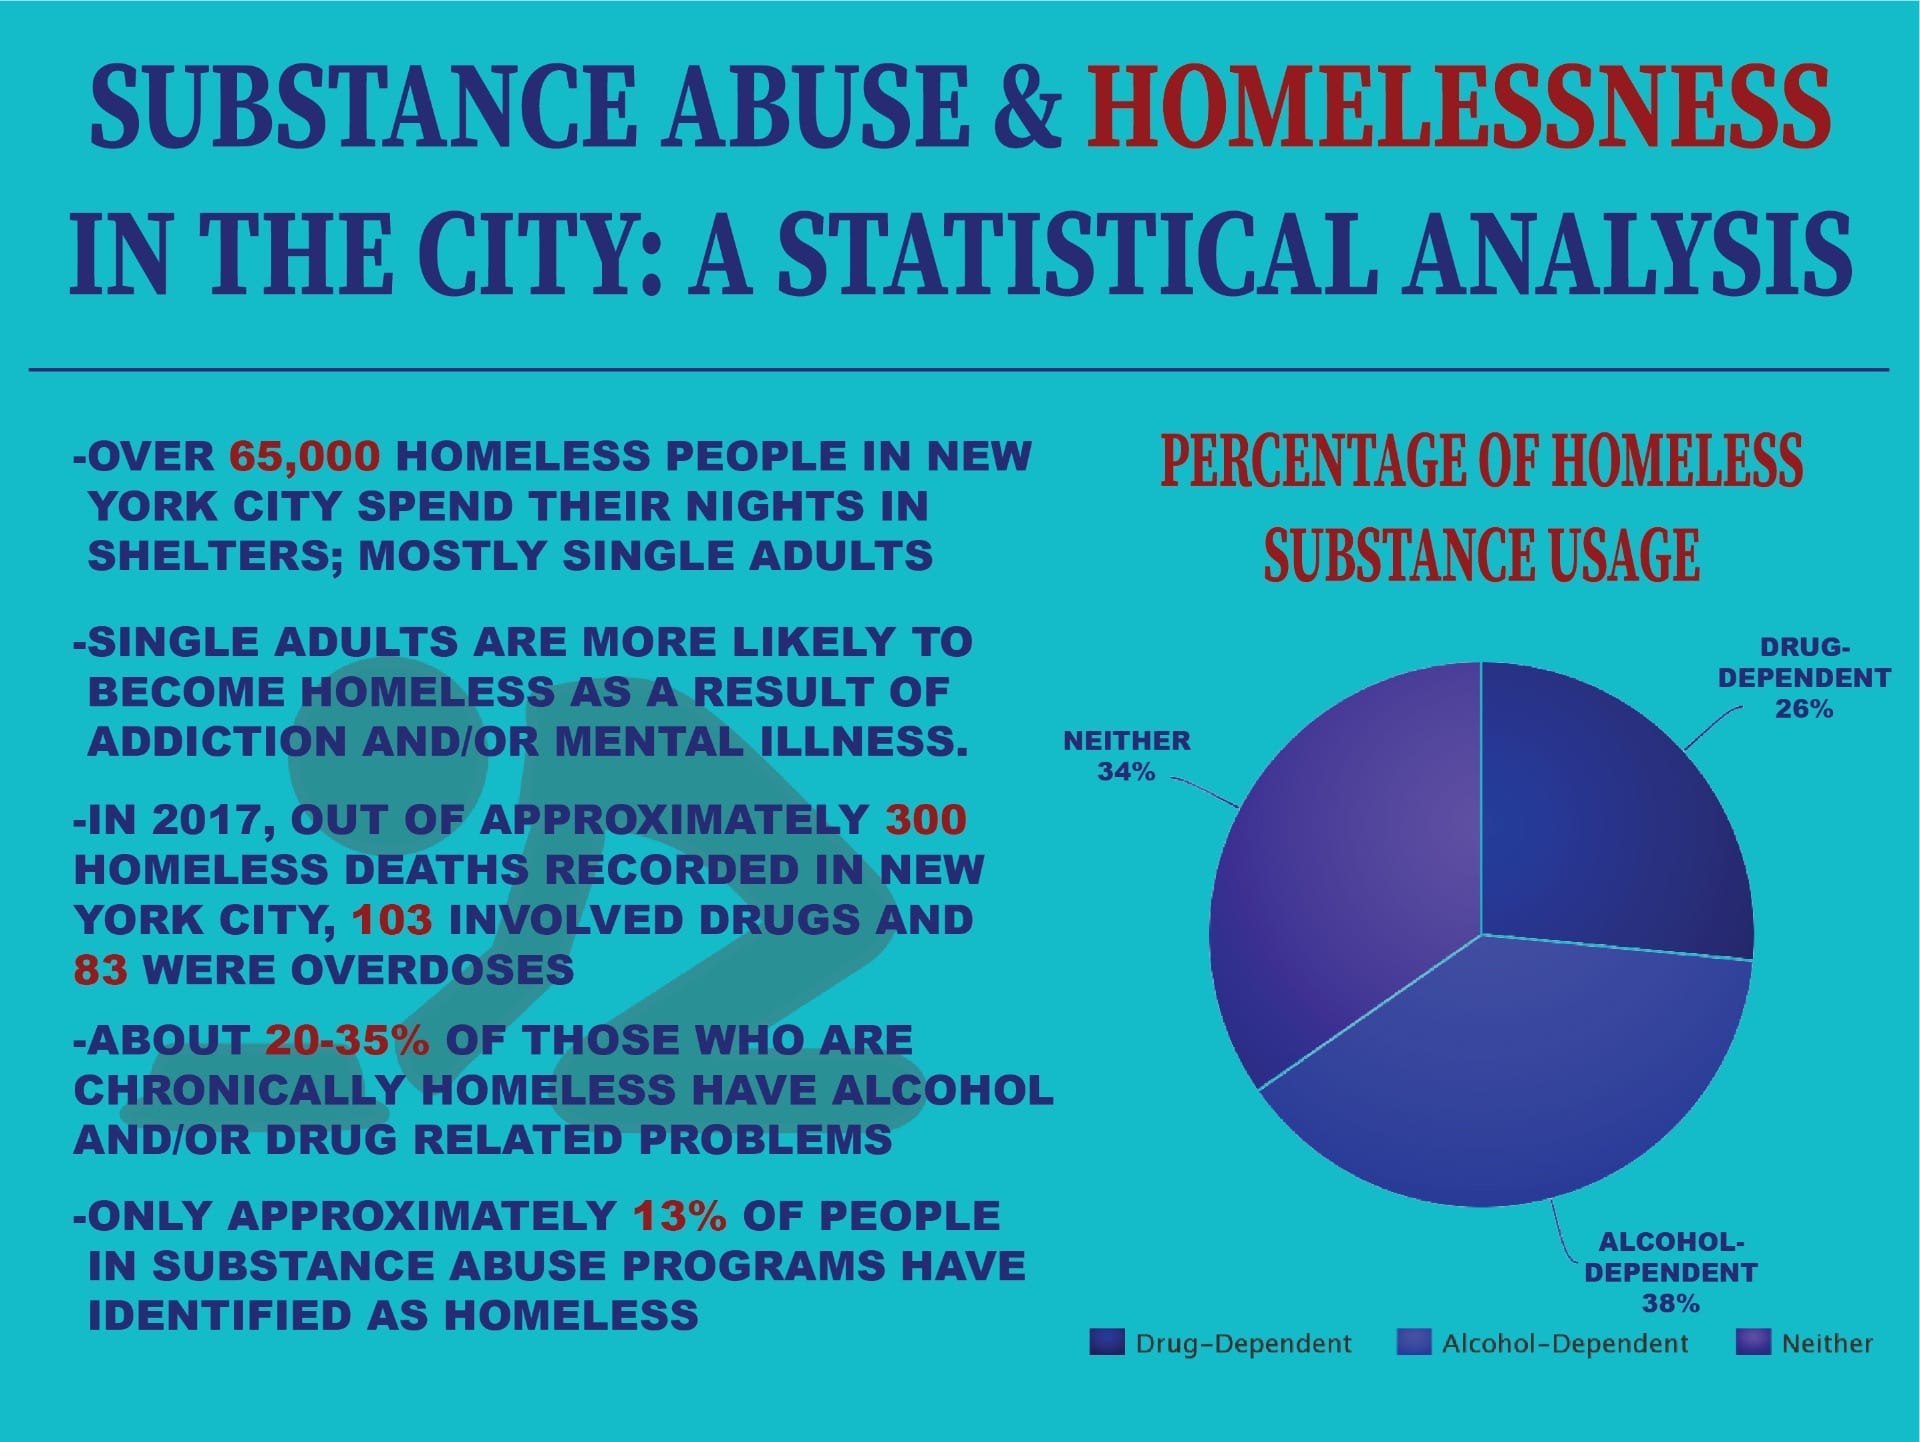
On the first design there was not much of a correlation between the title and what was presented on the poster, so we changed it from “Why It Matters” and “Did you know?” to “Substance Abuse & Homelessness in the City: A Statistic Analysis”. This title is more straightforward to readers and is a more appropriate way to present the text. We also had to reconsider the way we were presenting our data and how effective the pie charts were – four pie charts were indeed excessive and unnecessary. The statistics showing percentages of homeless people that use drugs or alcohol were merged into one chart and we erased the other bottom two charts. We felt that it was not necessary for the data to be presented in pie charts, so as an alternative, we put the removed pie charts’ information into a bullet point on the left hand column.