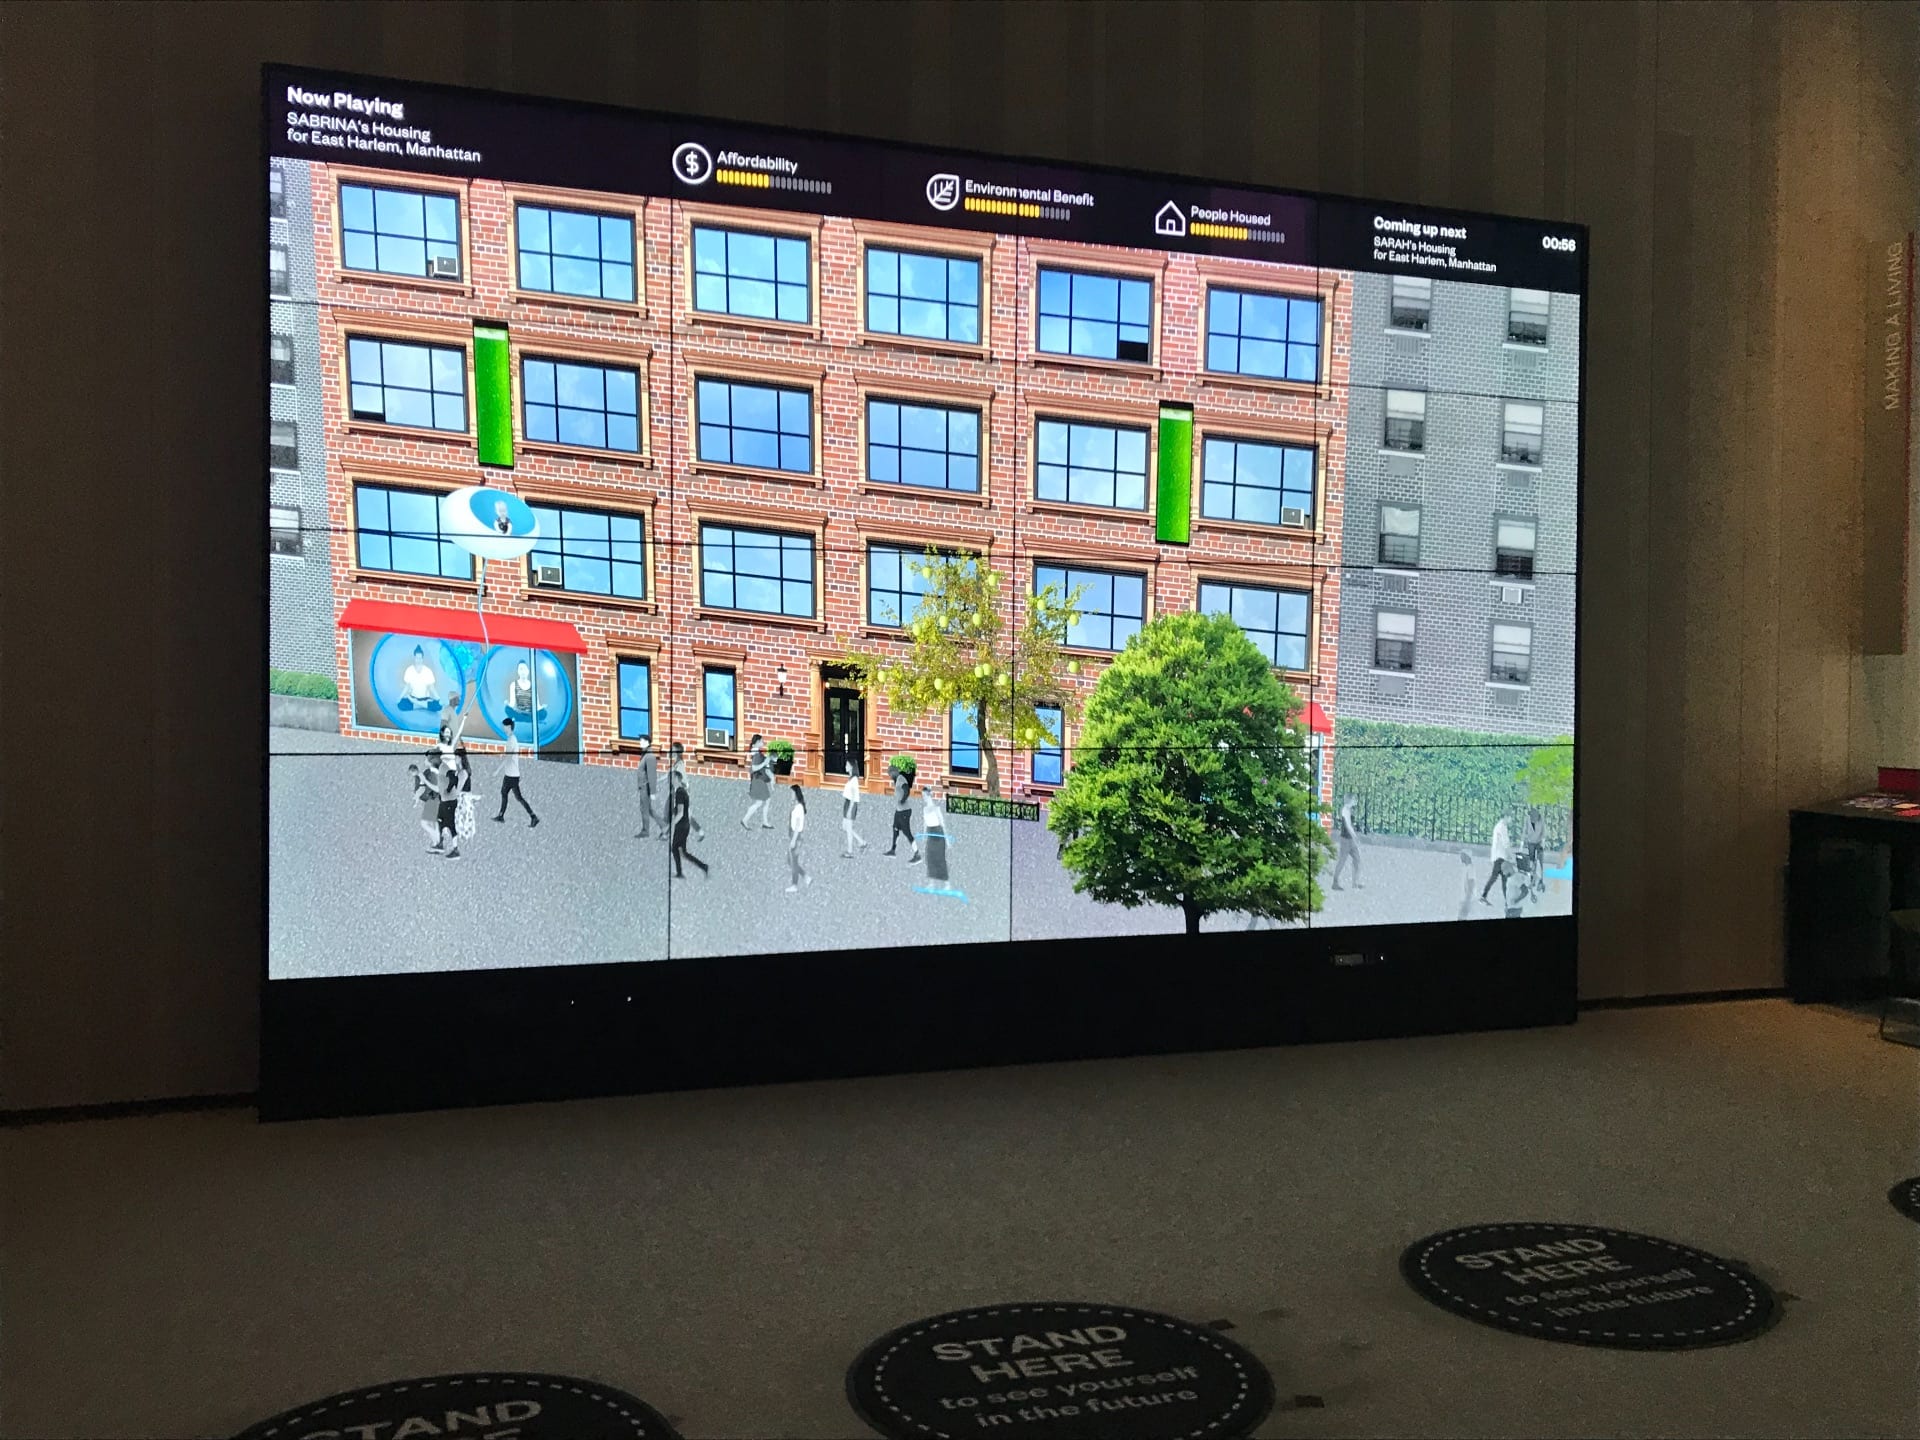
Response: The Future City Lab gallery at the Museum of City of New York “takes the pulse of the city today, highlights big challenges confronting New York now, and asks you to imagine possible responses”. Looking at the issues New York City faces can also help other cities worldwide (showing how important this gallery is). Challenges that are presented throughout the gallery include making a living, housing a growing city, living together, living with nature, and getting around. When I first walked into the space, I immediately saw a section of the exhibit titled “What If…”, comprised of a long table with small square cards on it that offers the views of knowledgeable New Yorkers on a variety of questions. There were interesting cards I came across that read “what if one ticket type could take you on the train, bus, light rail and ferry”, “what if we built floating houses in flood plain zones”, and “what if mothers that stayed home to raise their children and take care of the home were paid”. Pencils are provided so that visitors can pose their own “What If…” questions. After this, my eyes wandered over to the section of the exhibit titled “Mapping NYC 2000-2050”. It was comprised of a large, non-interactive screen that displayed a series of nearly 100 maps organized around basic questions about the city today like “who lives in the city?”, “where do they live?”, “how are neighborhoods evolving?”, “what jobs dominate?”, “where are jobs growing and shrinking?”, and “what do New Yorkers earn?” (as well as other questions revolving around transit, areas of open space scattered throughout the city and just overall changes that have been made over the years). This was a stimulating way to present data, and I felt that it gave me a good understanding and overall view of the city. Tied in with this was another section titled the “Data Nook” – small digital screens where maps, metrics for design games, data sources, and definitions could be found. The two parts of the exhibit I enjoyed most, though, were the “Neil Goldberg: Then & Now & Then” 25 minute video and the interactive screen where people could design their own future areas of the city (focusing on things like affordability, environmental benefits, number or people housed, safety, recreational opportunities and more). The video consisted of over 50 videos from residents across the five boroughs, and I felt that they had interesting opinions and ideas regarding the city that I hadn’t even considered. With the interactive “future” screen, I was able to design a housing unit in East Harlem and managed to get it so that the affordability, environmental benefit, and people housed meters were all filled to around 50% (as pictured above).