Assignment Description
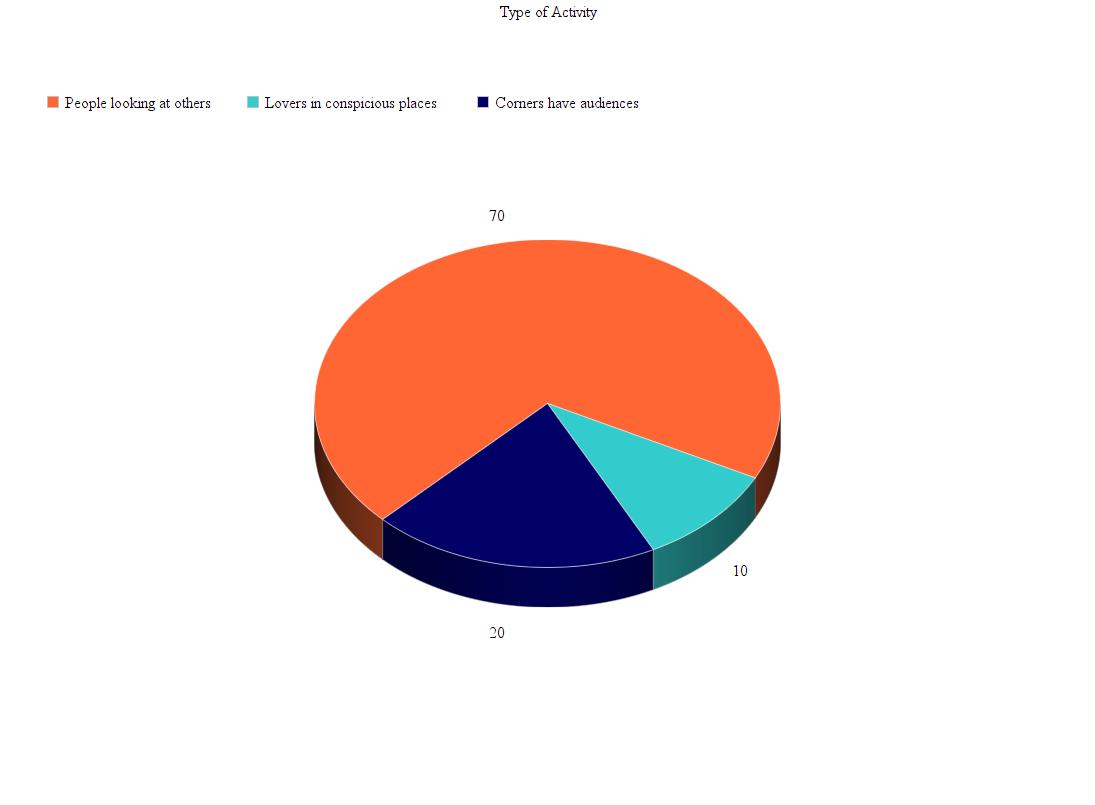
We were asked to watch the movie – The Social Life of Small Urban Spaces by William H. Whyte and from what we learned about data visualisation transform the important information from the movie into infographics of our choice such as graphs and charts. I chose to make 2 pie charts, 1 bar graph and 1 line graph. The information that is reflected in the images includes the types of activity in an outdoor space such a plaza, physical characteristics of the space, social interaction between people and lastly the involvement and use of street corners. This themes stood out to me from the movie and thus I chose to represent it in a visual way using a graph that suited the information the best.
Data Visualization


Reflection
The assignment was different since we had to display the information we grasped from the movie in a graphic form instead in the form of words. As I watched the movie I kept thinking about what information could be put together and it form will to best deliver the message. The movie was informative as well as comical. The part regarding the choices people make about where to sit and how to sit was extremely interesting. The fact that the problem was shown not to be overuse but to be underuse was shocking to me. I learnt that simple observations such as the behaviour of people in regard to the sun, the temperature, the time of day can change the result. Learning about the importance of sociability and criteria of qualitative sitting spaces were two large themes that I took away from the movie.