-
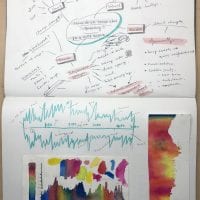
- Mind map & initial sketches
-
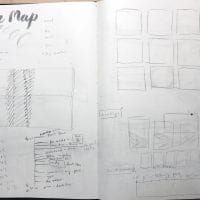
- initial idea development
-
- comprehensive sketch
-
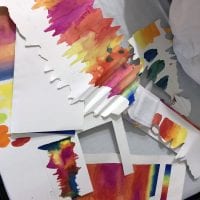
- experimenting with paper shapes

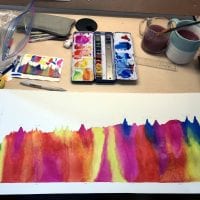
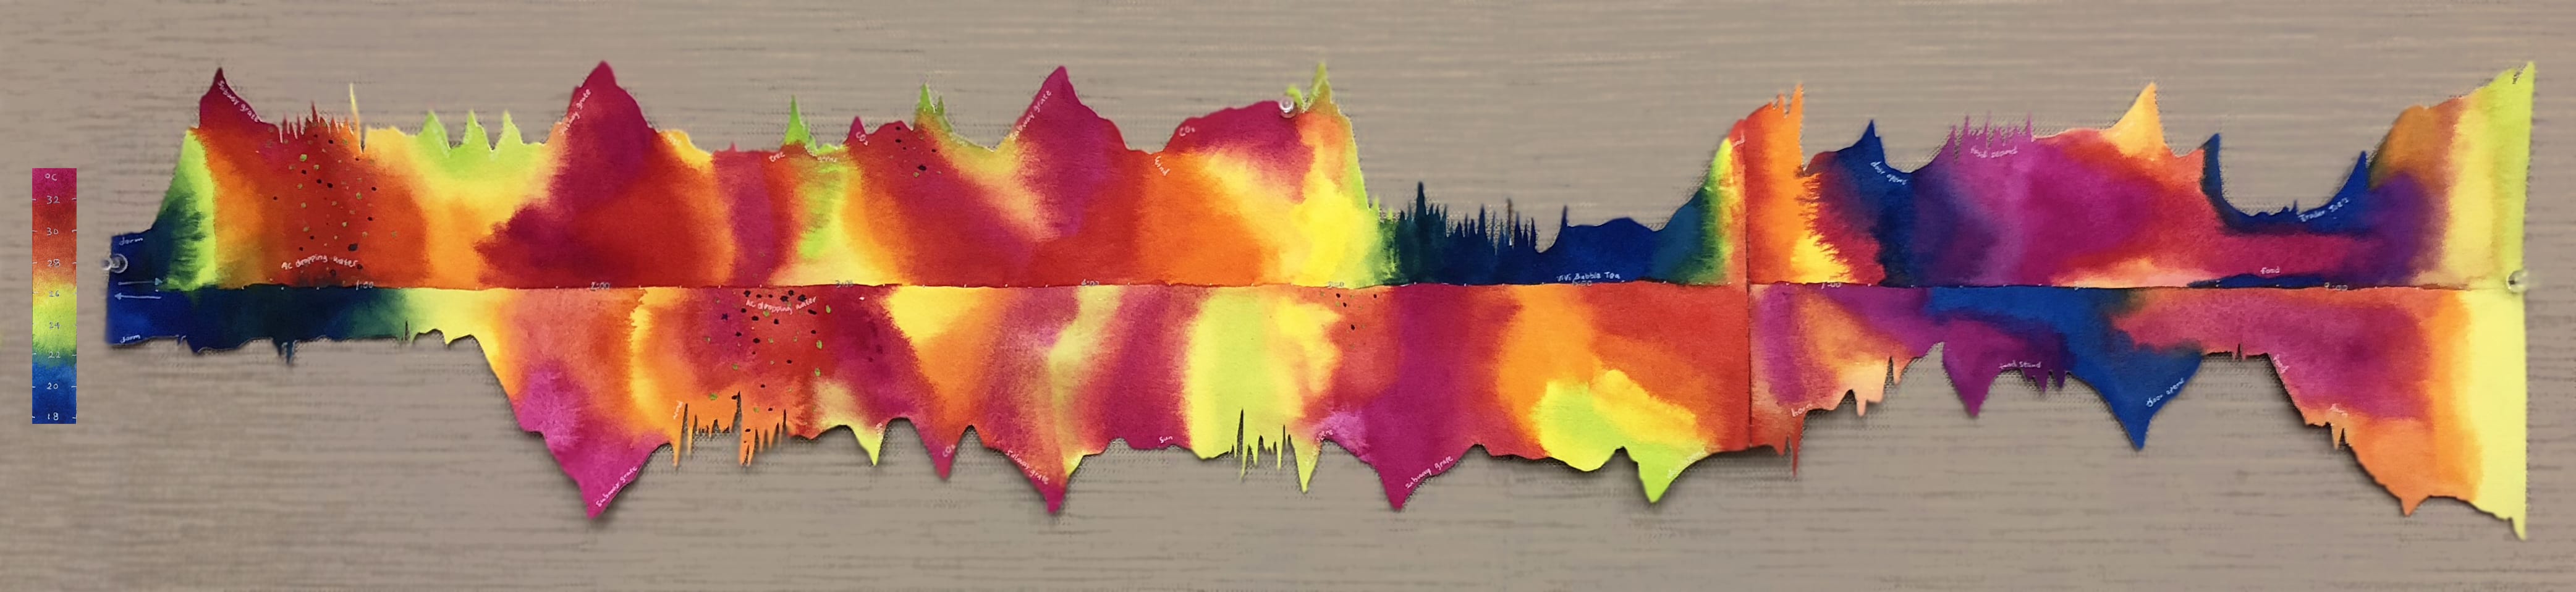
Time map final
On a different background
Temperature chart
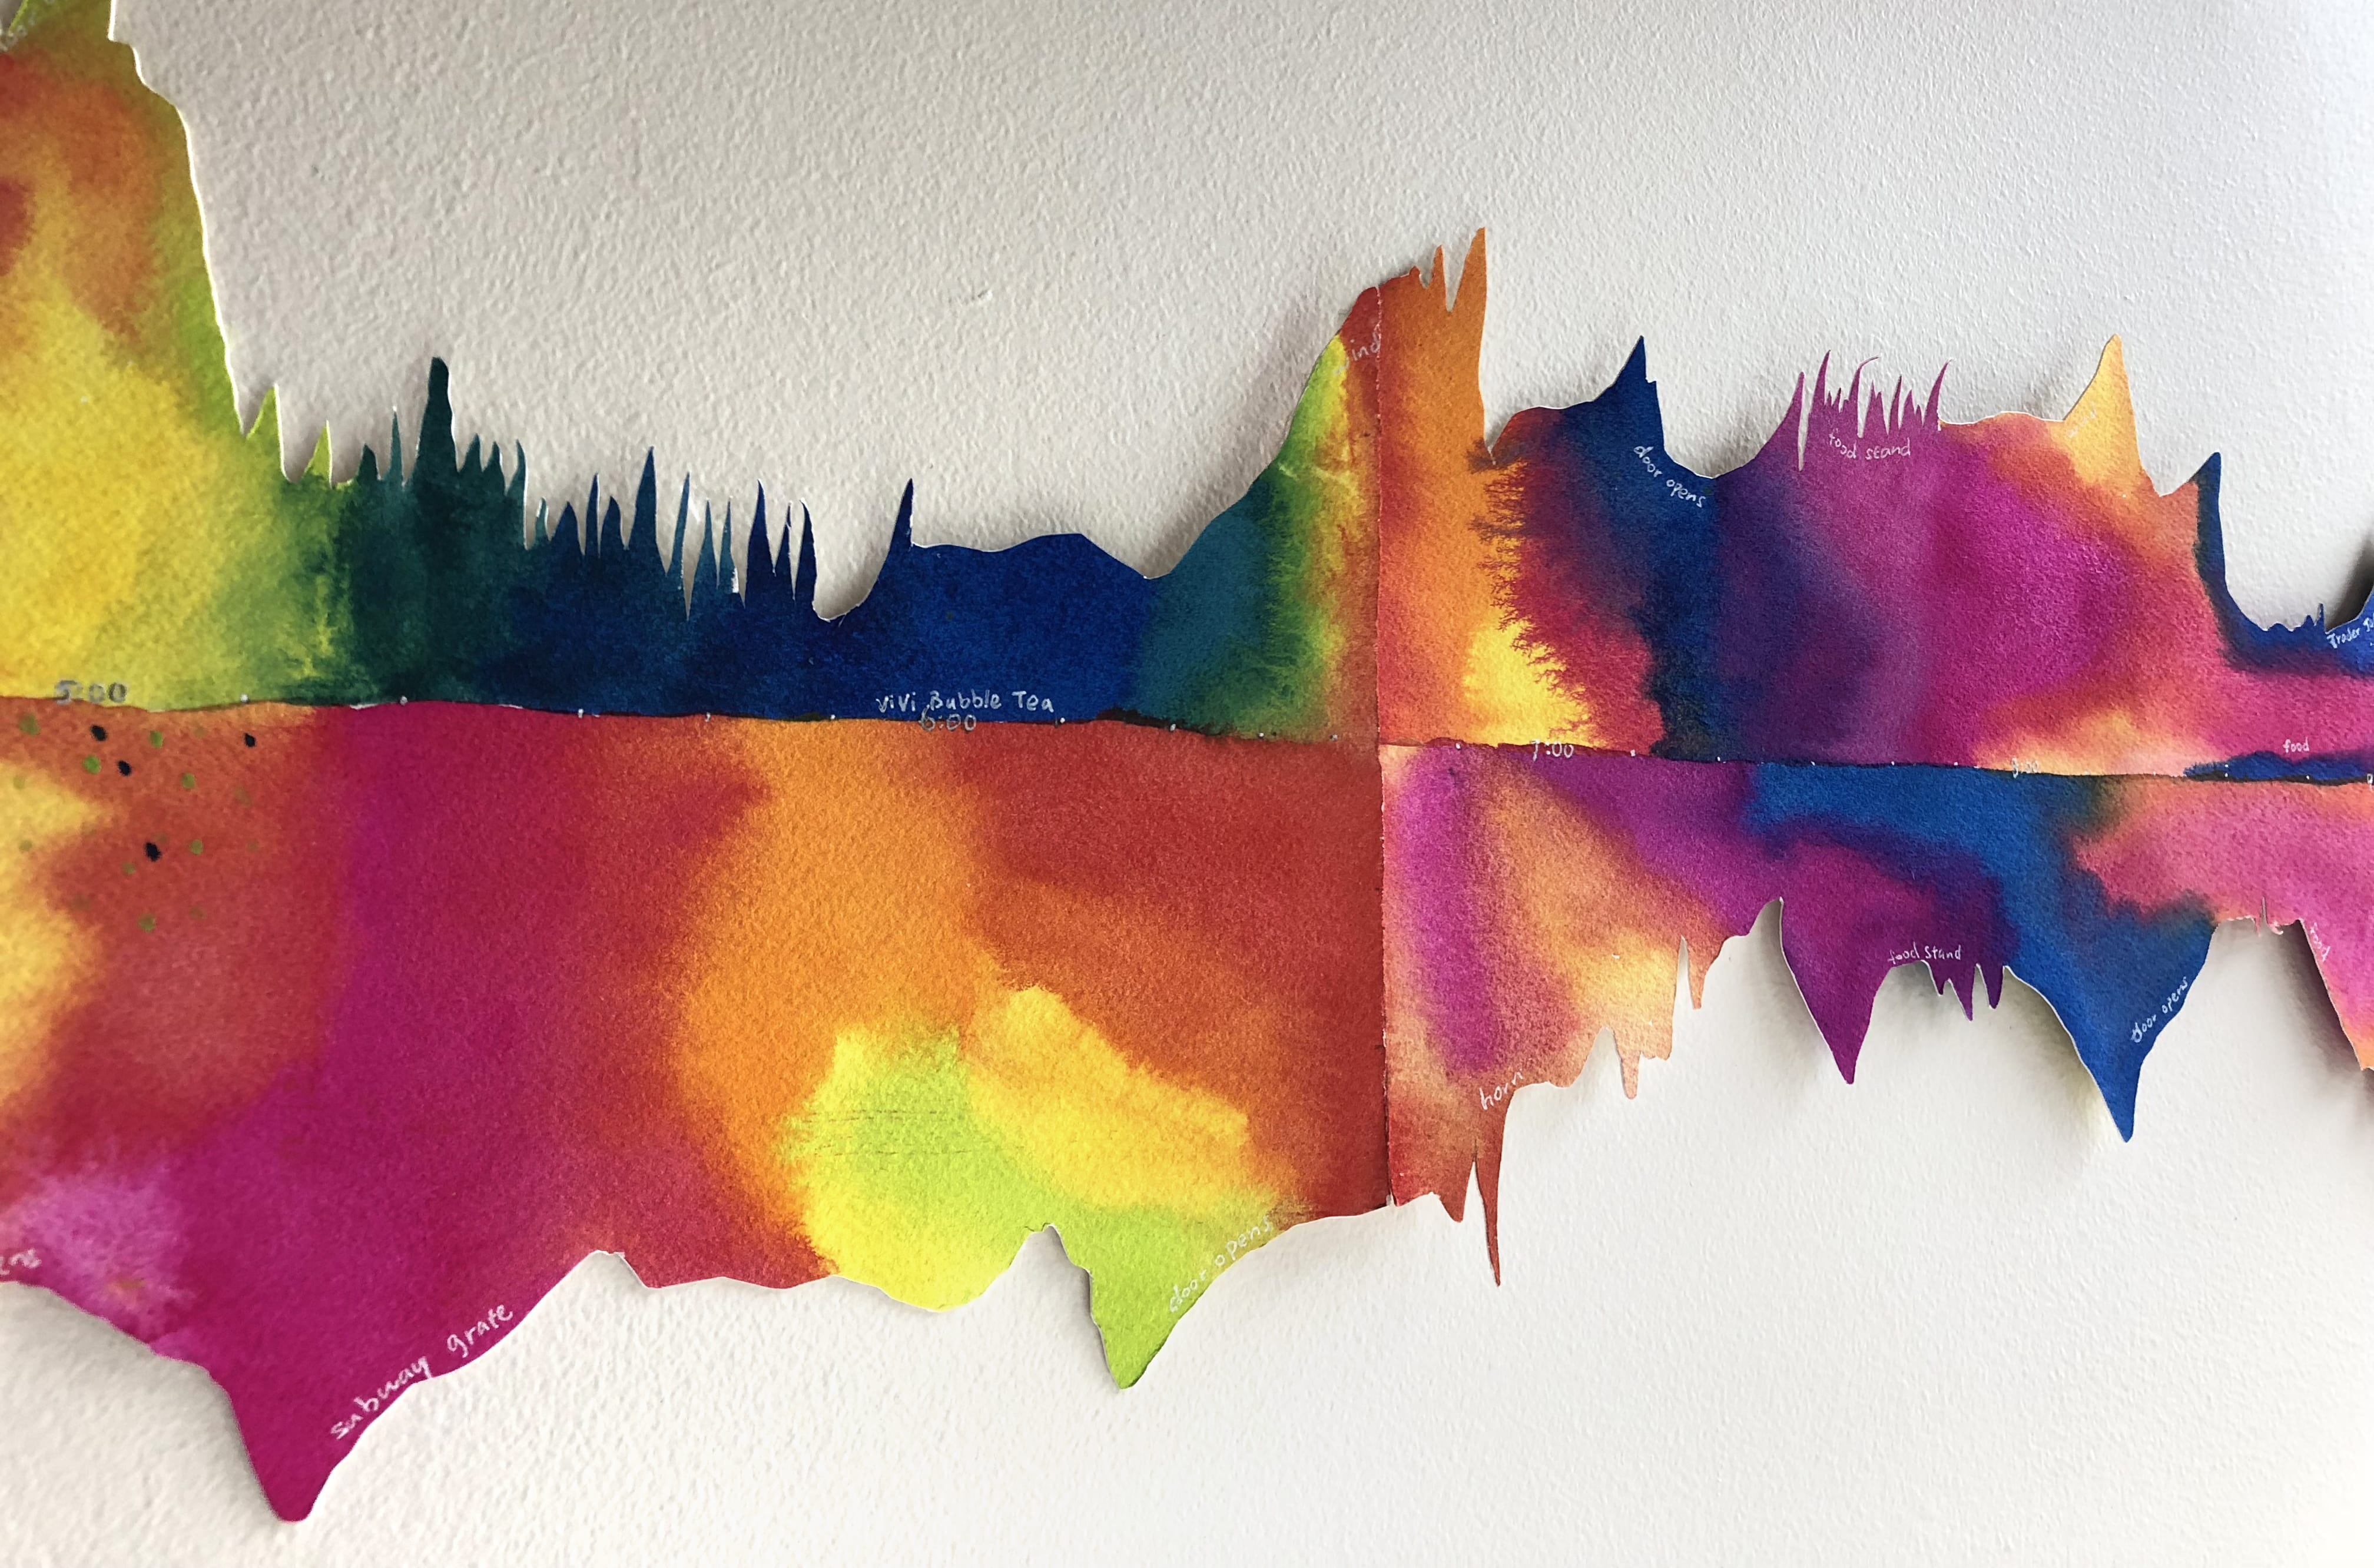
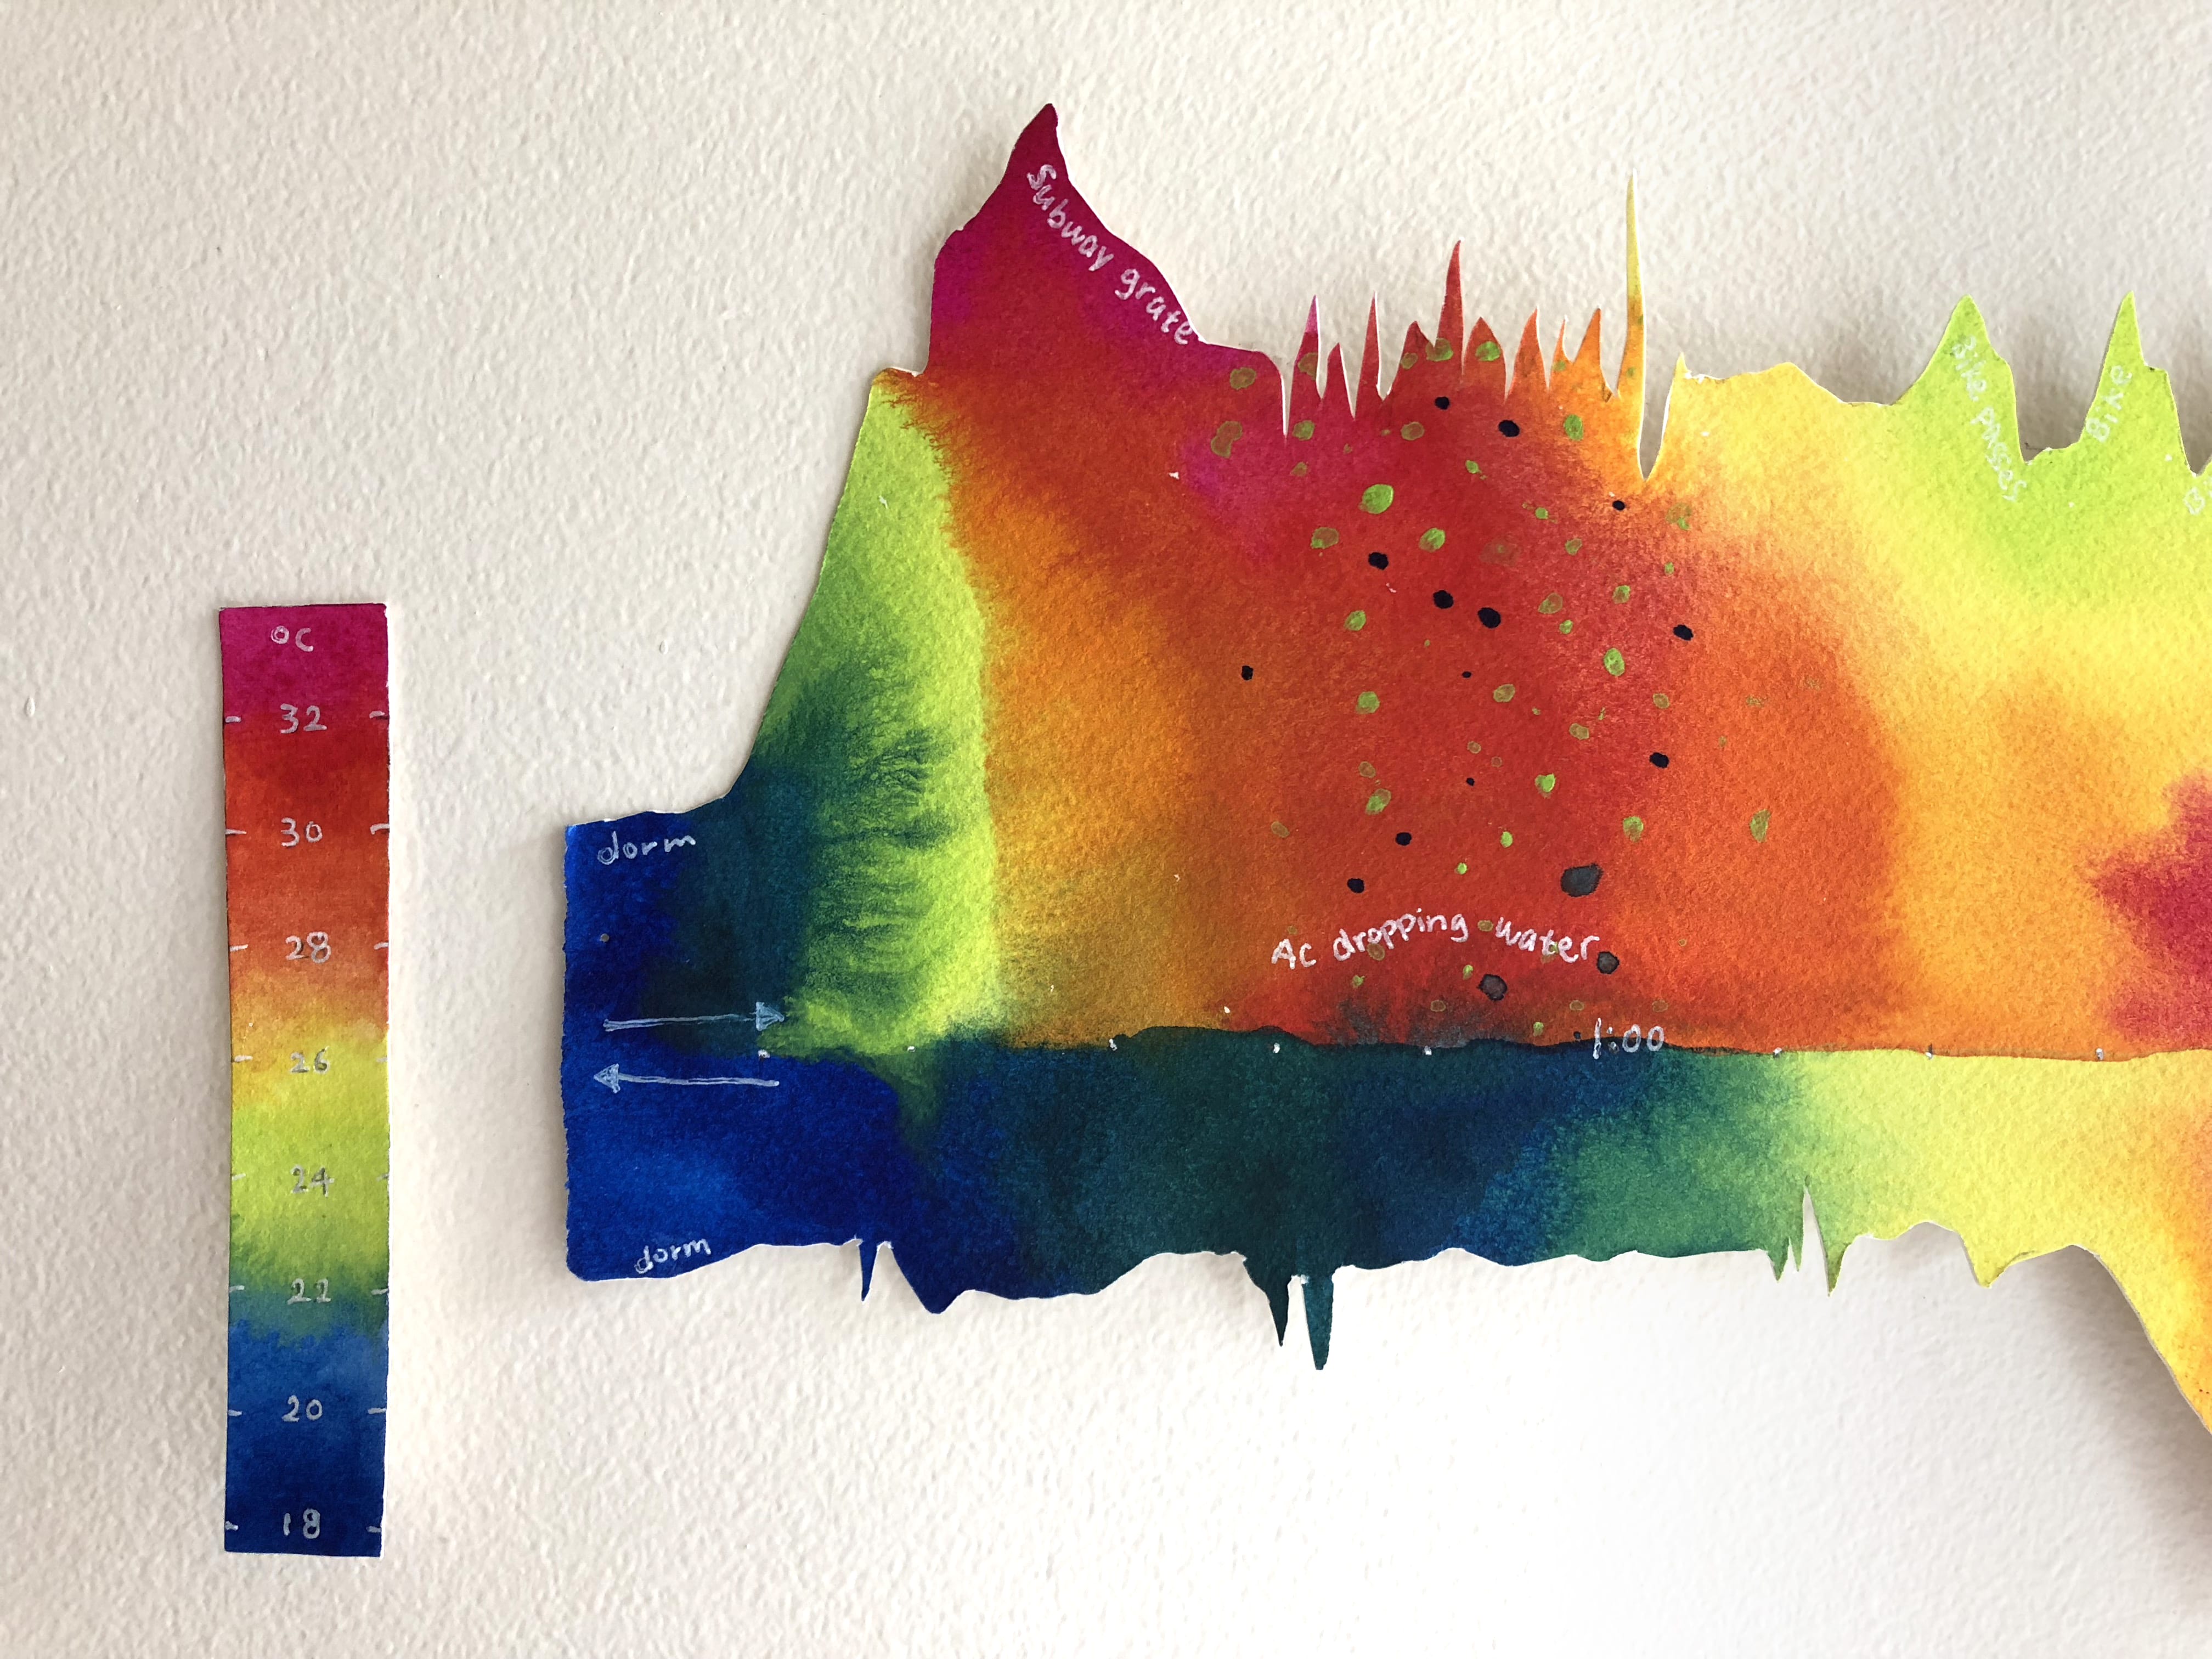
Details
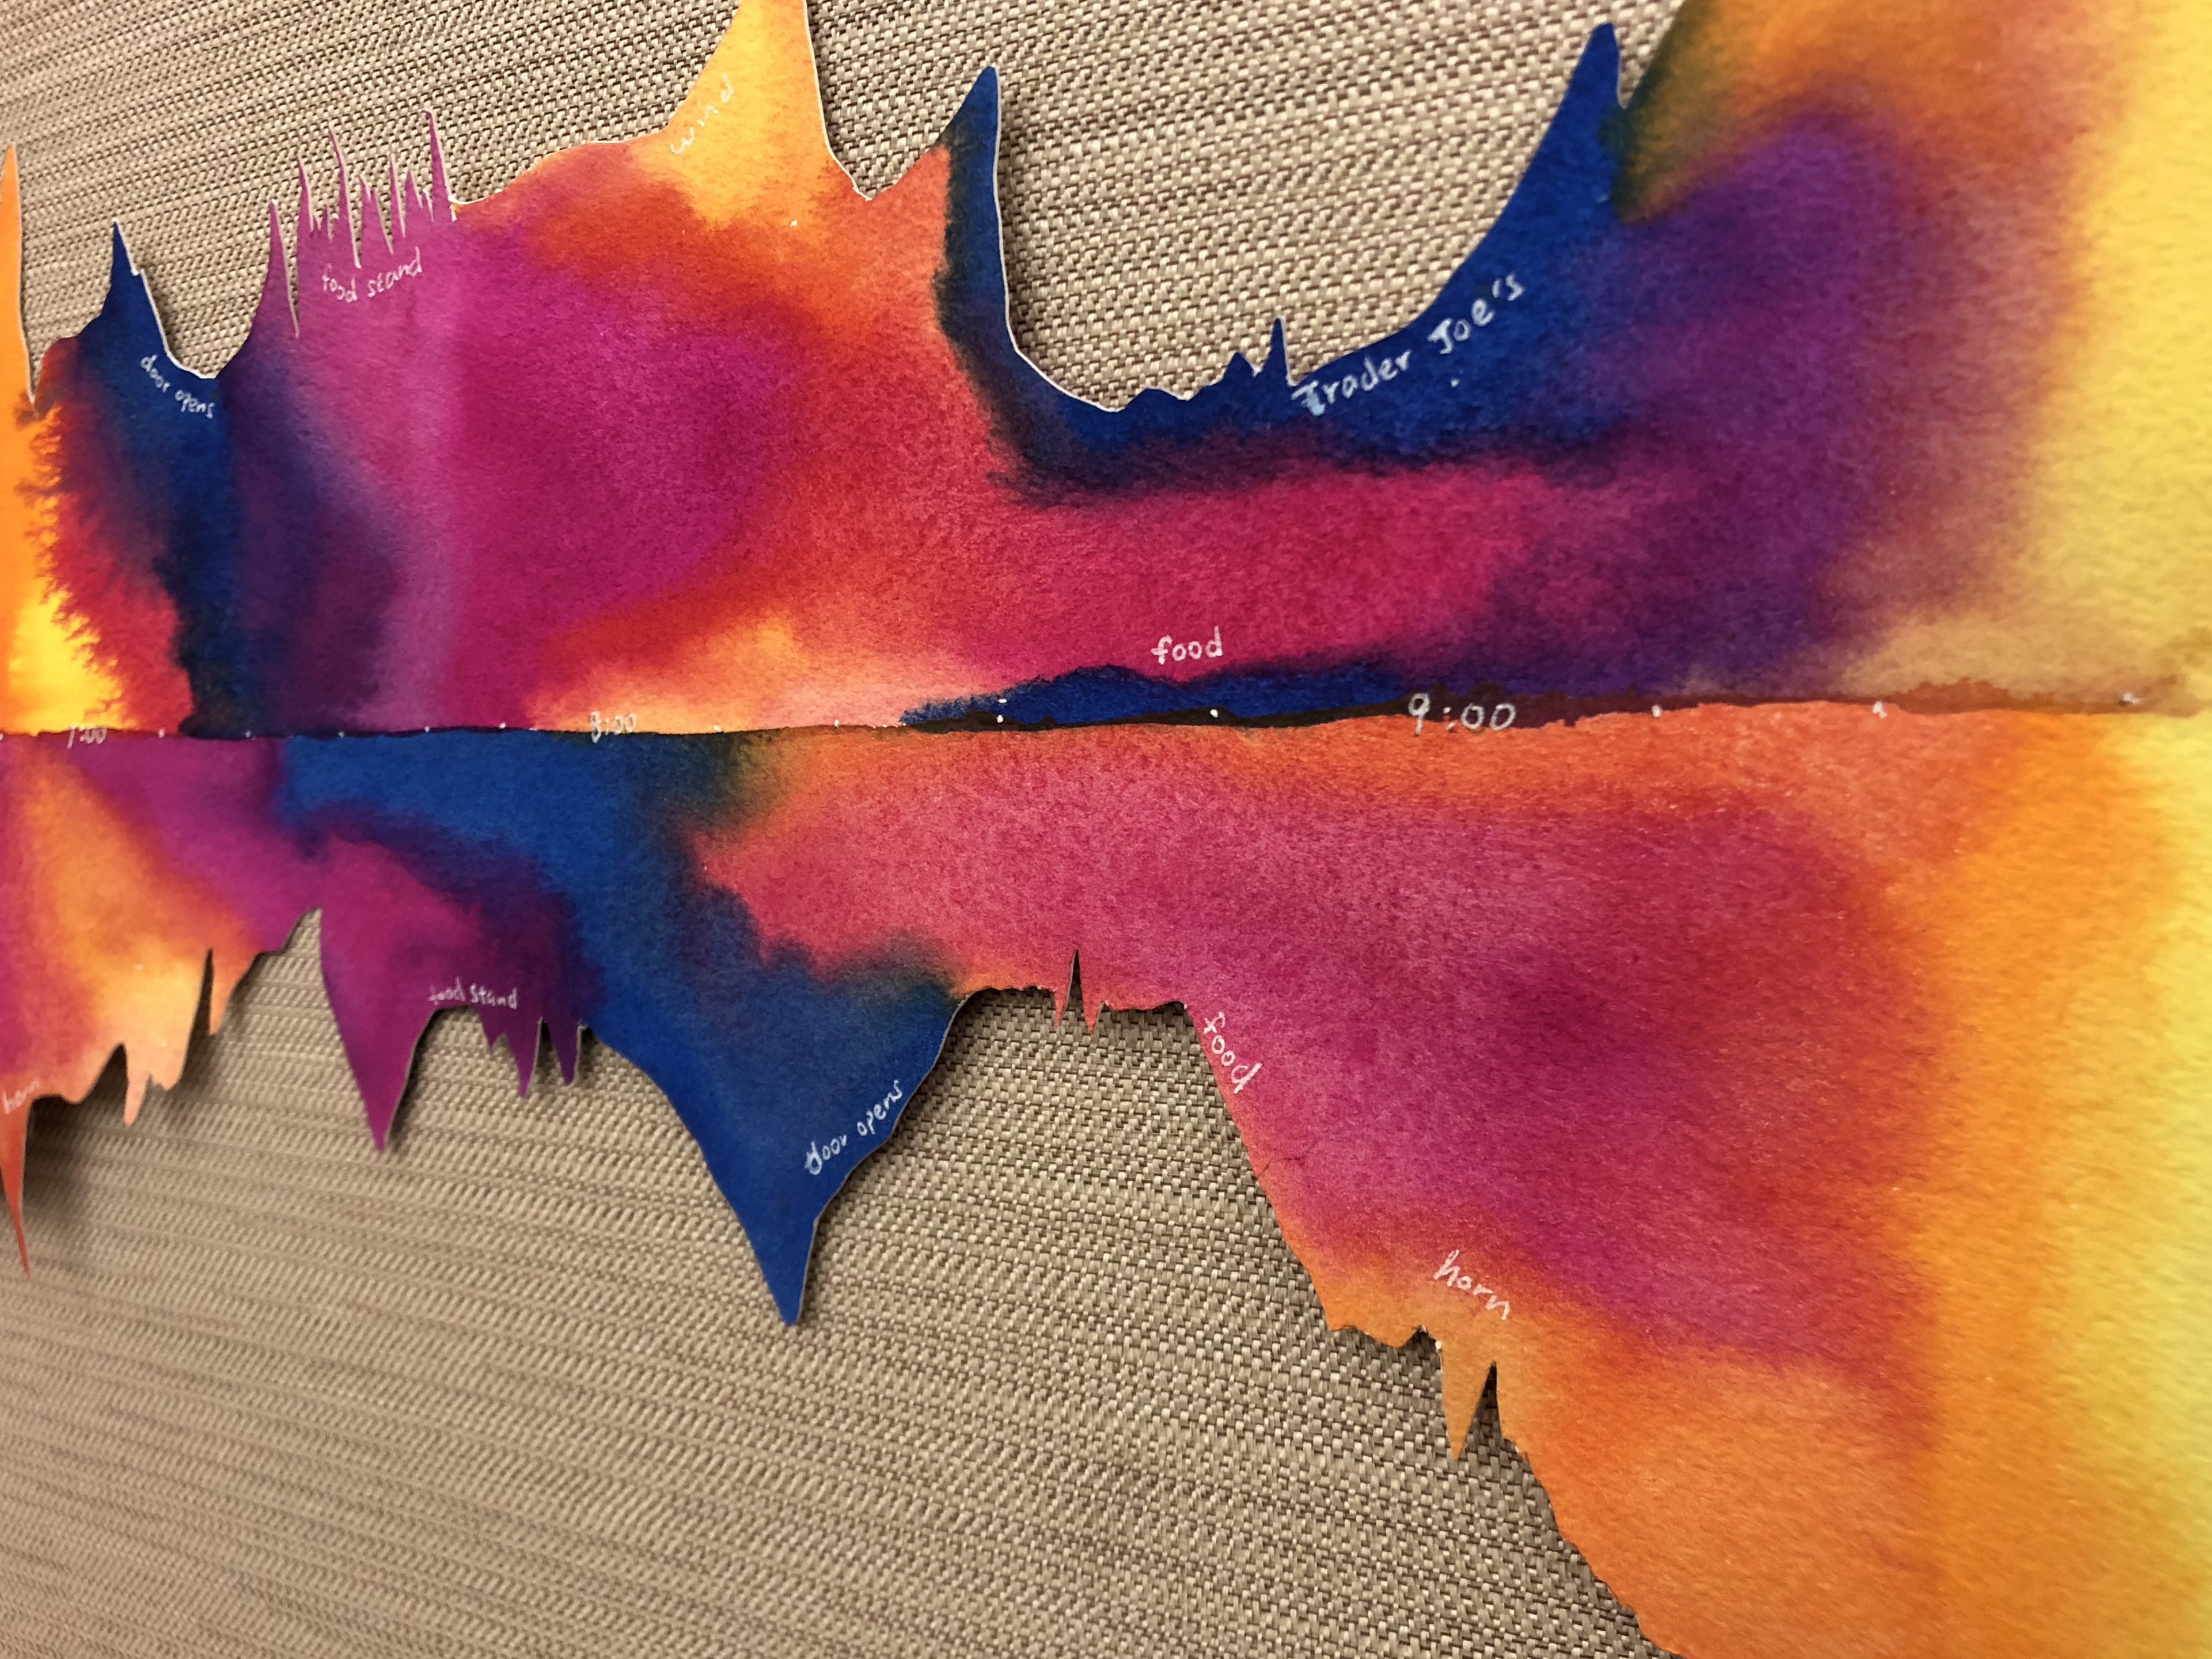
Details
As I walked around a city block, the strongest sensation I felt was the change in temperature as time passes by: the heat coming up from a subway grate, the AC water dropping down from buildings, the cold air coming from a store as the door opened, the wind as a bike passes by, etc. My project is a documentation of the temperature in relation to time throughout my journey; the map above the timeline is my trip to and below is my trip back taking the exact same route. I took inspiration from thermal infrared cameras which capture the variation of temperature in objects, and tried to simulate the look of an infrared image using watercolor. The color that correspond to each temperature was determined by the color scale used on thermal cameras. As I noticed during my journey that a change in temperature often came with sound, I also added sound waves on the edges of the map to make it more interesting.