INT STUDIO 2 BRIDGE 2- MAP -26bejoa
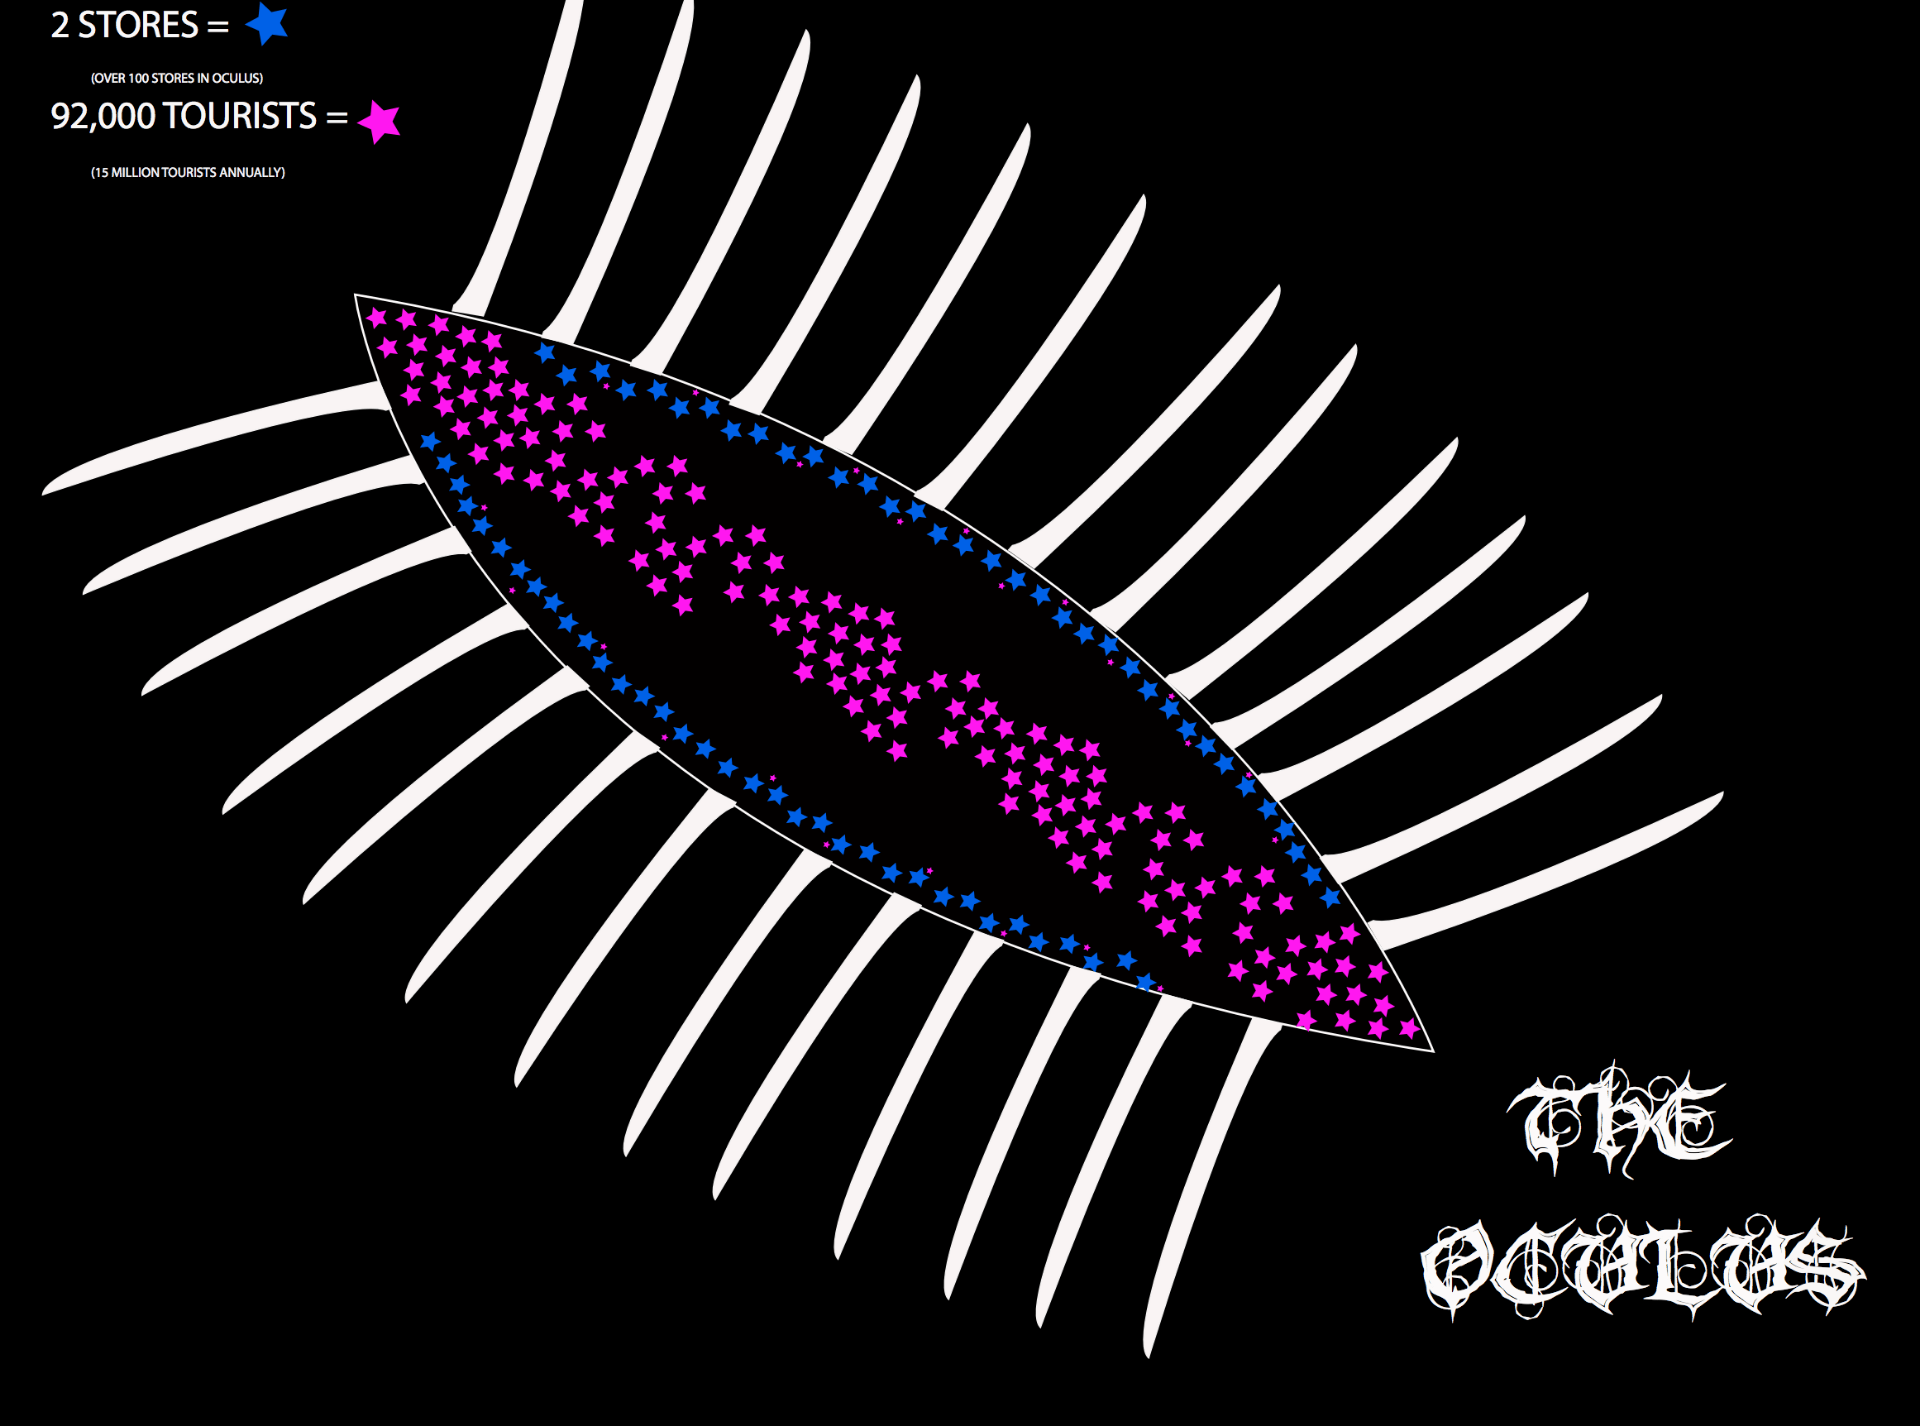
When creating my map of the Oculus, I knew that I wanted the viewer to clearly see how 2 different systems within the Oculus effect each other. In order to do this, I first had to decide which systems to focus on. Although there are many important systems that make up the Oculus, I decided to choose the tourism system and consumerism/stores. I did this because the system of selling goods, in most landmarks, is usually reliant on the amount of tourists buy the products / are in that area. Next, I conducted some research on the actual number of tourists that visit the Oculus, as well as the number of stores within the Oculus, and the results were very telling. What I found was that the amount of tourists that visit the Oculus annually is 15 million tourists, and 100 stores throughout the Oculus. After reading this, it was very clear to me that the consumerism/stores system is taking advantage of the popularity in tourism the Oculus brings by bringing luxury clothing and accessory stores to the landmark. I thought it would be very interesting to convey this through a map, so I did just that. I used Adobe Illustrator to create the Oculus, and used different colored stars to represent the different systems and the statistics stated above. I also paid attention to color and detail, by making the stars brighter than the actual Oculus in order to attract more attention to the statistics.
Overall, this type of map was fun to create because it is unconventional and not favored by the majority of society. However, I believe that making maps creative and enticing is what will eventually draw tourists to visit a specific place.