Doglyphics Scatterplot
Transubstantiation Key Album Cover
Low–Quorum
David Bowie– Neukolln
https://www.youtube.com/watch?v=MojW0fVaaFE
Hiroshi Yoshimura – Soundscape 1: Surround (Full Album)
Count Ossie and the Mystic Revelations of Rastafari — Bongo Man
UFO– Love to Love
Above I have posted two major projects I have completed for my Medieval Multimedia class:
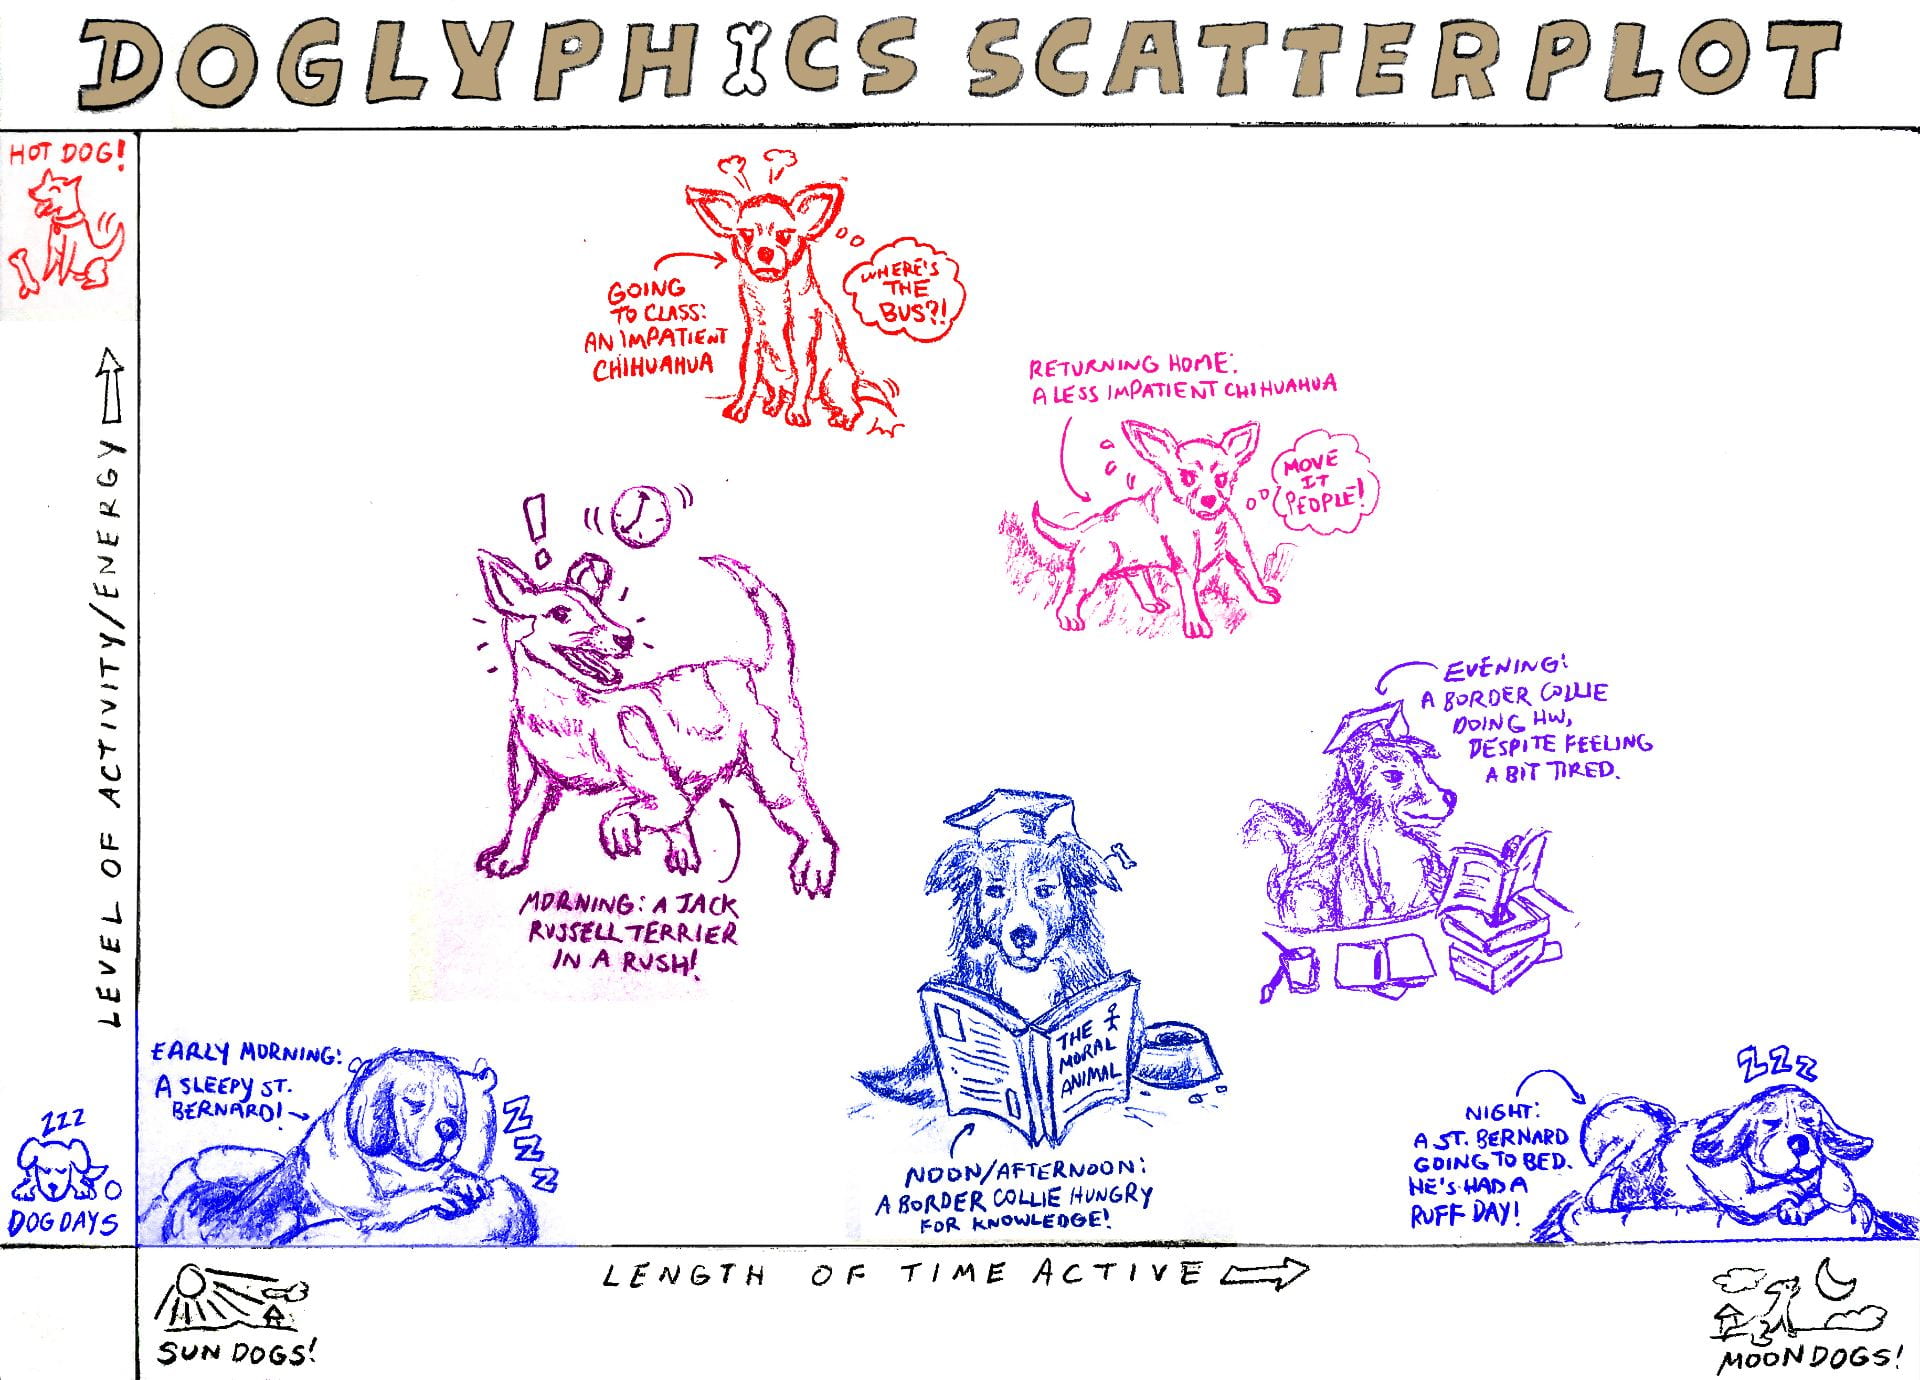
- The first is called “Doglyphics Scatterplot” and is essentially a graph which measures my level of energy/activity throughout the day as well as the intensity of my energy using illustrated dogs as a sort of notation. This project was done in response to the initial prompt of the project: create a non-standard representation of notation akin to that in medieval manuscripts about music, but not with music notes. Have objects in real life or something that is not a music note allegorically represent something else that can be captured by notation. For my project, different dog species, based on their characteristics and temperaments represent different levels of energy that I have throughout the day, and are notated as such:
St. Bernards are known for being big sleepers, so they are at the bottom of the graph and represent my low energy at the beginning and end of the day.
Jack Russell Terries are known for being high energy– so I placed one in the middle of the graph to represent my morning rush to get to school.
Chihuahuas, although small, are notorious for their hyperactive, loud, and often annoying personalities, so I used them as a representation of my irritability and impatience waiting for the bus. They are the highest on the graph.
Border Collies, often labeled the most intelligent dog breeds, represent my relative state of calm while in college, studying and taking notes as well as absorbing knowledge. They are higher on the graph in intensity when compared to the St. Bernards because studying or reading is a low level activity that does not reach the level of sleep.
I also used color coding in my chart as an additional layer of representation– higher intensity activities or situations are increasingly red, while lower intensity activities are more blue (in reference to temperature being represented as hot, cold, or in between, using red and blue as standard colors). I initially drew the chart on paper, then scanned it and modified it on Photoshop.
- My second project is much more recent and was part of a larger group project with two classmates of mine. We were tasked with creating a “meme” of our very own but in an allegorical medieval style, which introduces an element of magic of transformation. The three of us decided to create an album with a series of songs that would each represent the five stages of grief. Each instrument used in each song would also allegorically represent an emotion, thereby transubstantiating into something else while retaining its appearance and shape. I volunteered to create the “transubstantiation key” that would let people know which instrument in which song represented which emotion, and we all chose songs that had elements of previous songs within it. For the stage of grief called “Acceptance”, I chose the song “Love to Love” by the band UFO, which had qualities present in all the previous songs as well as many instruments. The song itself also had a hopeful tone, with the guitar solo at the end of the song symbolically representing to me the final triumph of the individual against grief.
After we all initially had problems trying to find a way to record and transmit the songs we chose on vinyl record, we mutually decided to change our object to a CD. I converted all of the Youtube songs to MP3 files, and burned the music onto a disc set I bought using my old PC (which was slow, making the whole process very tedious). I also created my transubstantiation key on Illustrator, downloading fonts and creating designs that were visually analogous to the tone of the songs we chose, and the cultures/genres that they were produced from (and which were similar in color scheme to the covers of the songs on Youtube). In the design, I specifically placed the songs in ascending order (Low-Quorum– the first song, representing Denial, being at the very bottom) to the represent the progressive rise of the individual from the point of grief towards his/her acceptance of the grief, with each song symbolizing an individual’s progressively improving emotional situation.
The Hiroshi Yoshimura song was too large to install here on this post as an MP3, so I have it up as a Youtube link.