Project Statement:
The issue I decided to work with is under the umbrella of food waste and deals with the misallocation of excess food, raw ingredients, and uneaten food in private households. The United Nations would define food waste as; “any removal of food from the food supply chain which is or was at some point fit for human consumption, or which has spoiled or expired, mainly caused by economic behavior, poor stock management or neglect.” Even though the food loss problem is not given much media attention, it is factually just as harmful as the misuse of a major resources, including water, land, energy, labor and capital. Such misuse of food, like the misuse of any other resource, leads to the production of greenhouse gas emissions, and greatly contributes to global warming and climate change.
I have decided to develop an application concept that teaches individuals about the risk of food scarcity, the reality of our food, and the different ways to utilize food waste. This results in a sustainable utilization of the waste that they create, the usage of otherwise wasted energy, and brings communities together.
Inspiration Along the Way:
- In Class #3, looking at different examples of infographics and focusing on what makes an infographic easy to read helped me map out my infographic design.
- In Class #4, we presented an elevator pitch about our project and then shared ideas together. The fruitful conversations that came out of it inspired me to also include a communication element in my solution.
- In Class #5, we explored the concept of wicked problems and systems thinking which made it clear to me that my issue is surely a wicked problem so naturally my solution needs to be a form of systems thinking.
- In Class #6, we presented a draft of our infographics and I took many notes from that. (Balance between text and visuals, use symbolic visuals, use both photographs and drawings, use symbolic colors, make it interactive.)
- In Class #9, the majority of my inspiration hit. I was yoyo-ing between two ideas (an application/an experiment) but after watching Crowd + Cloud and seeing how technology can be used to increase sustainability I was immediately driven to creating the application. In addition, I was introduced to crowdsourcing a concept I wasn’t familiar with, and decided to also add it into my application model.
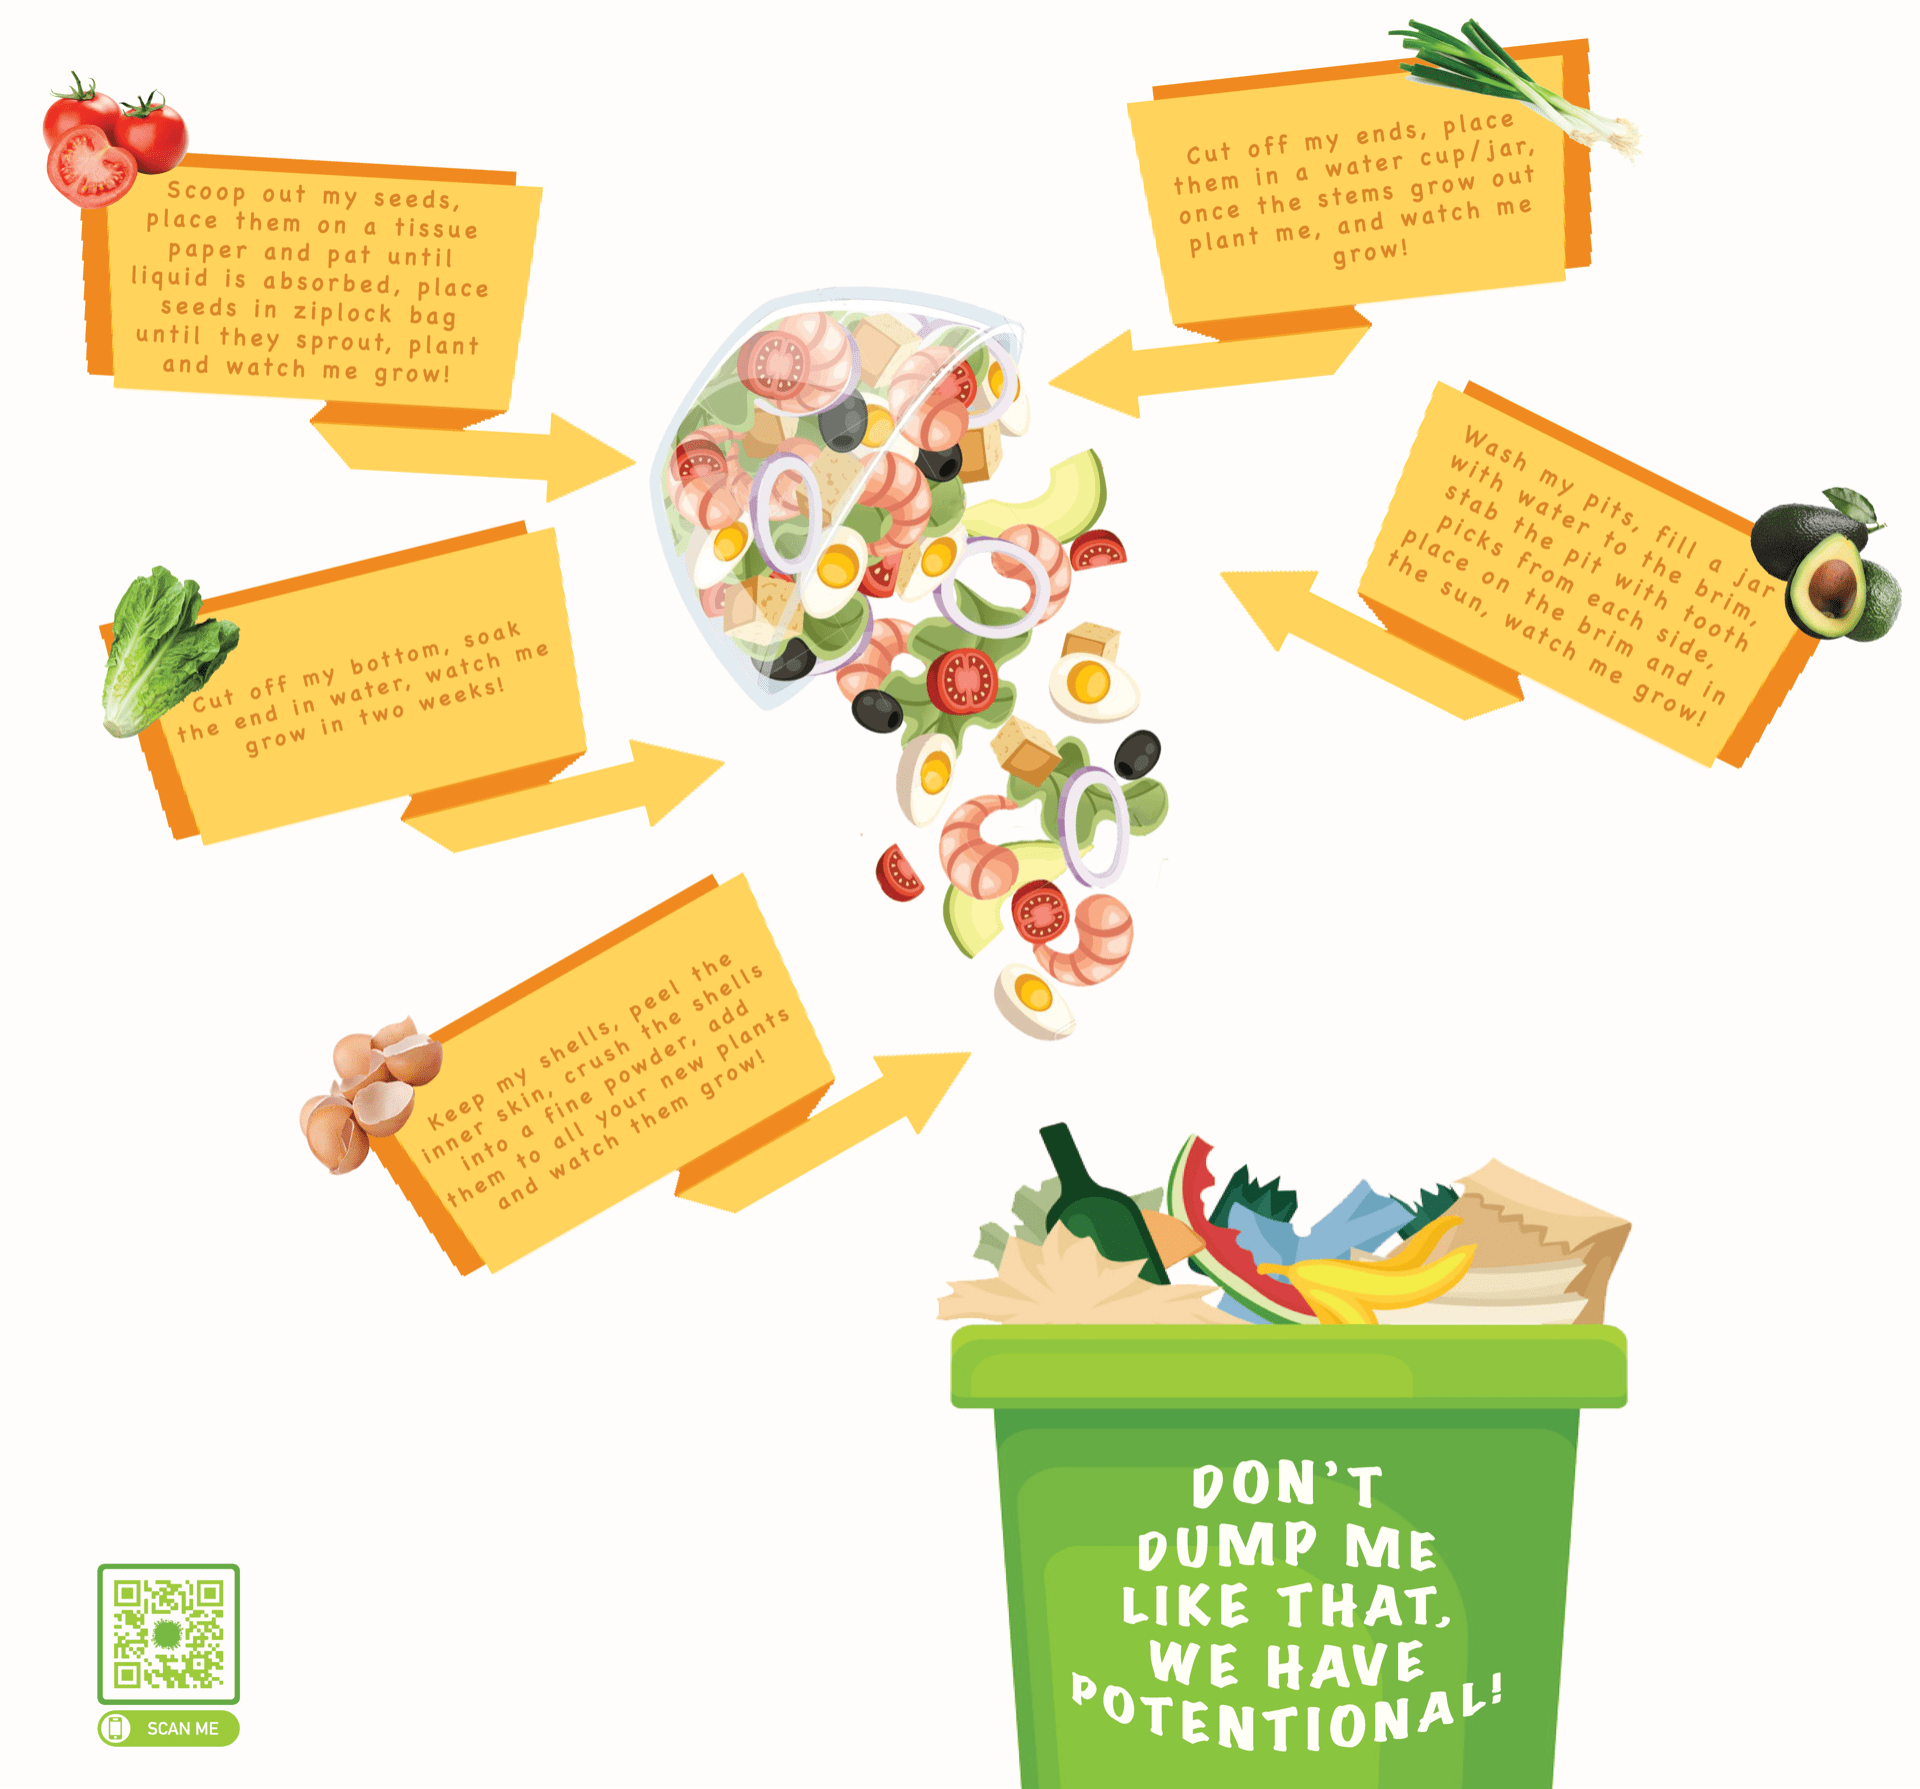
- In Class #10, the pandemic hit and we began transitioning back home. Seeing many people struggle to get food on their plates assured me how important my topic is. Realizing that food has became scarce in my household, I began taking note of how I can grow my own produce from what I already have (which is all the information that has been put into my infographic!)
- In Class #13, I had pretty much everything I needed except I was a little hesitant about the design of my infographic. I was assigned to watch a video about Brian Jungen’s art making practice. What he basically does is deconstruct recognizable objects, and then create new life out of them. In a way, that is exactly what I want my project to do, deconstruct the reality of one of the most recognizable elements of our life (food), and repurpose or rebirth what is left of it. This is absolutely what inspired my infographic’s layout.
Infographic Drafts:
Final Infographic:
Object:
Thank you Zeighn– this just so beautiful! Thank you too for documenting your iterative process so that one can understand the development of your concept and presentation. Clarity has been one of your characteristics in this course, as have been exertion and enthusiasm. I very much appreciate your presence and the wonderful work you have done in this course. Thank you! ML