NOTES – Conditions/Issues/Challenges/Successes
- Micro-fibers in clothes get into water
- 800 mil of plastic bottles are used in NYC/year
- Exfoliating beads made from plastics in toothpastes or body washes get into the waterway and don’t dissolve once spit out or washed off
- Solution: Micro net that captures .3 millimeters
- Made of aluminum
- Catches toothpaste beads, plastic bags, styrofoam
- Beware of toothpastes with polyethylene
- Plastic have been with us since World War II
- The discovery of bad plastics is very young
- Gyre – 5 main gyre in oceans
- Ocean currents bring together all of the trash
- High tech device allowed to determine how much plastic was in water finally developed
- Troll
- Approximately 5.2 trillion particles of plastic was found
- Ideas on ideas to sift plastic is becoming difficult
- Need to deviate around the idea of disposable items
- Newton creek is the backyard of making the city possible
- What happens to your body happens to the earth
- The earth is breaking down at the same time your body is
- Look at the smallest plastic sources
- Landfill
- Can see plastics in water
- Albatross birds being killed by plastics in their bellies
Clean Water Acts/ Super Fund
The CWA is a federal law that was put in place by the United States in order to govern water pollution. It is a basic structure to regulate pollutants in the water and the quality standards for the surface waters. It also sets wastewater standards. It is now illegal to discharge pollution to navigable waters unless a permit was obtained.
Source: http://www2.epa.gov/laws-regulations/summary-clean-water-act
The Super Fund is a government run fund to clean up the nations hazardous waste sites.
Source: http://www.epa.gov/superfund/
On a scale I would put both of these examples on the 10^5-10^7 scale. Both are held on a national basis. Meaning they aim to clean up the United states. However, if we scale back farther we can see that this would benefit not only our nation, but the surrounding nations and the planet as a whole.
In an illustration I would place side by side a comparison of what would the legislation aims for versus what might happen without these acts to environment. I would want to show a full range of possibilities of what is to come on a global scale.
I would also want to illustrate the issue on a small such as the Albatross birds. One event can end up becoming so impactful that people end up recognizing it as an issue and feel evoked to promote awareness for the problem. However, the scale has to be at the same size as them or else people wound up confused and distracted from the original problem. The scale needs to be relatable to them.
What does it mean for polluters like Exxon when you go online and discover that Newton Creek and Gowanus are Super Fund sites?
I don’t think it is that surprising that these sites might promote the Super Fund websites. Newton Creek and Gowanus directly deal with receiving the waste we create and they directly attack the issue of water pollution and wastefulness by attacking back as the source that caused the problem. These areas are threatened by these types of companies since they have already been made into a dump. In order to at least prevent from any more waste from coming through they defend themselves against polluters by teaming up with government run organizations such as Super Fund.
A diagram of this kind illustrates one of the issues you recorded, but could cover two or more scales – (1) 10 ^ 7 illustrating the federal Act and Super Fund, (2) 10 ^ 0 how the water looked at the surface with industry at the shore ( a picture you captured), and (3) 10 – 2 for worms and fish that may have mutated from the effects of industrial pollution, (4) 10 – 5 for # of recorded cancer occurrences of people who live near Newtown creek and (5) 10 – 8 for how the NYC Billion Oyster Project on Governor’s Island is helping to clean our waterways at a cellular/molecular level to reduce viruses that kill the health of our water’s ecology. So with one large illustration you would have five scales represented – two items captured/ heard on the trip and three items that come from additional research on the topic your heard about briefly on the trip.
As stated before, I chose to illustrate the problem with the Albatross birds. This type of bird is threatened faster than any other types of birds with 17 out of 22 species of albatross being globally threatened for extinction. In order to portray this issue, I sketched it out on five different scales. They are killed in such vast amounts that they can’t breed enough in time.
The albatrosses used fly across the world ocean’s 50 million years ago. Now they are known to be located in all of the world’s oceans except for the North Atlantic. Although they are seen to typically populate the Southern Hemisphere.
Source: http://www.rspb.org.uk/joinandhelp/donations/campaigns/albatross/
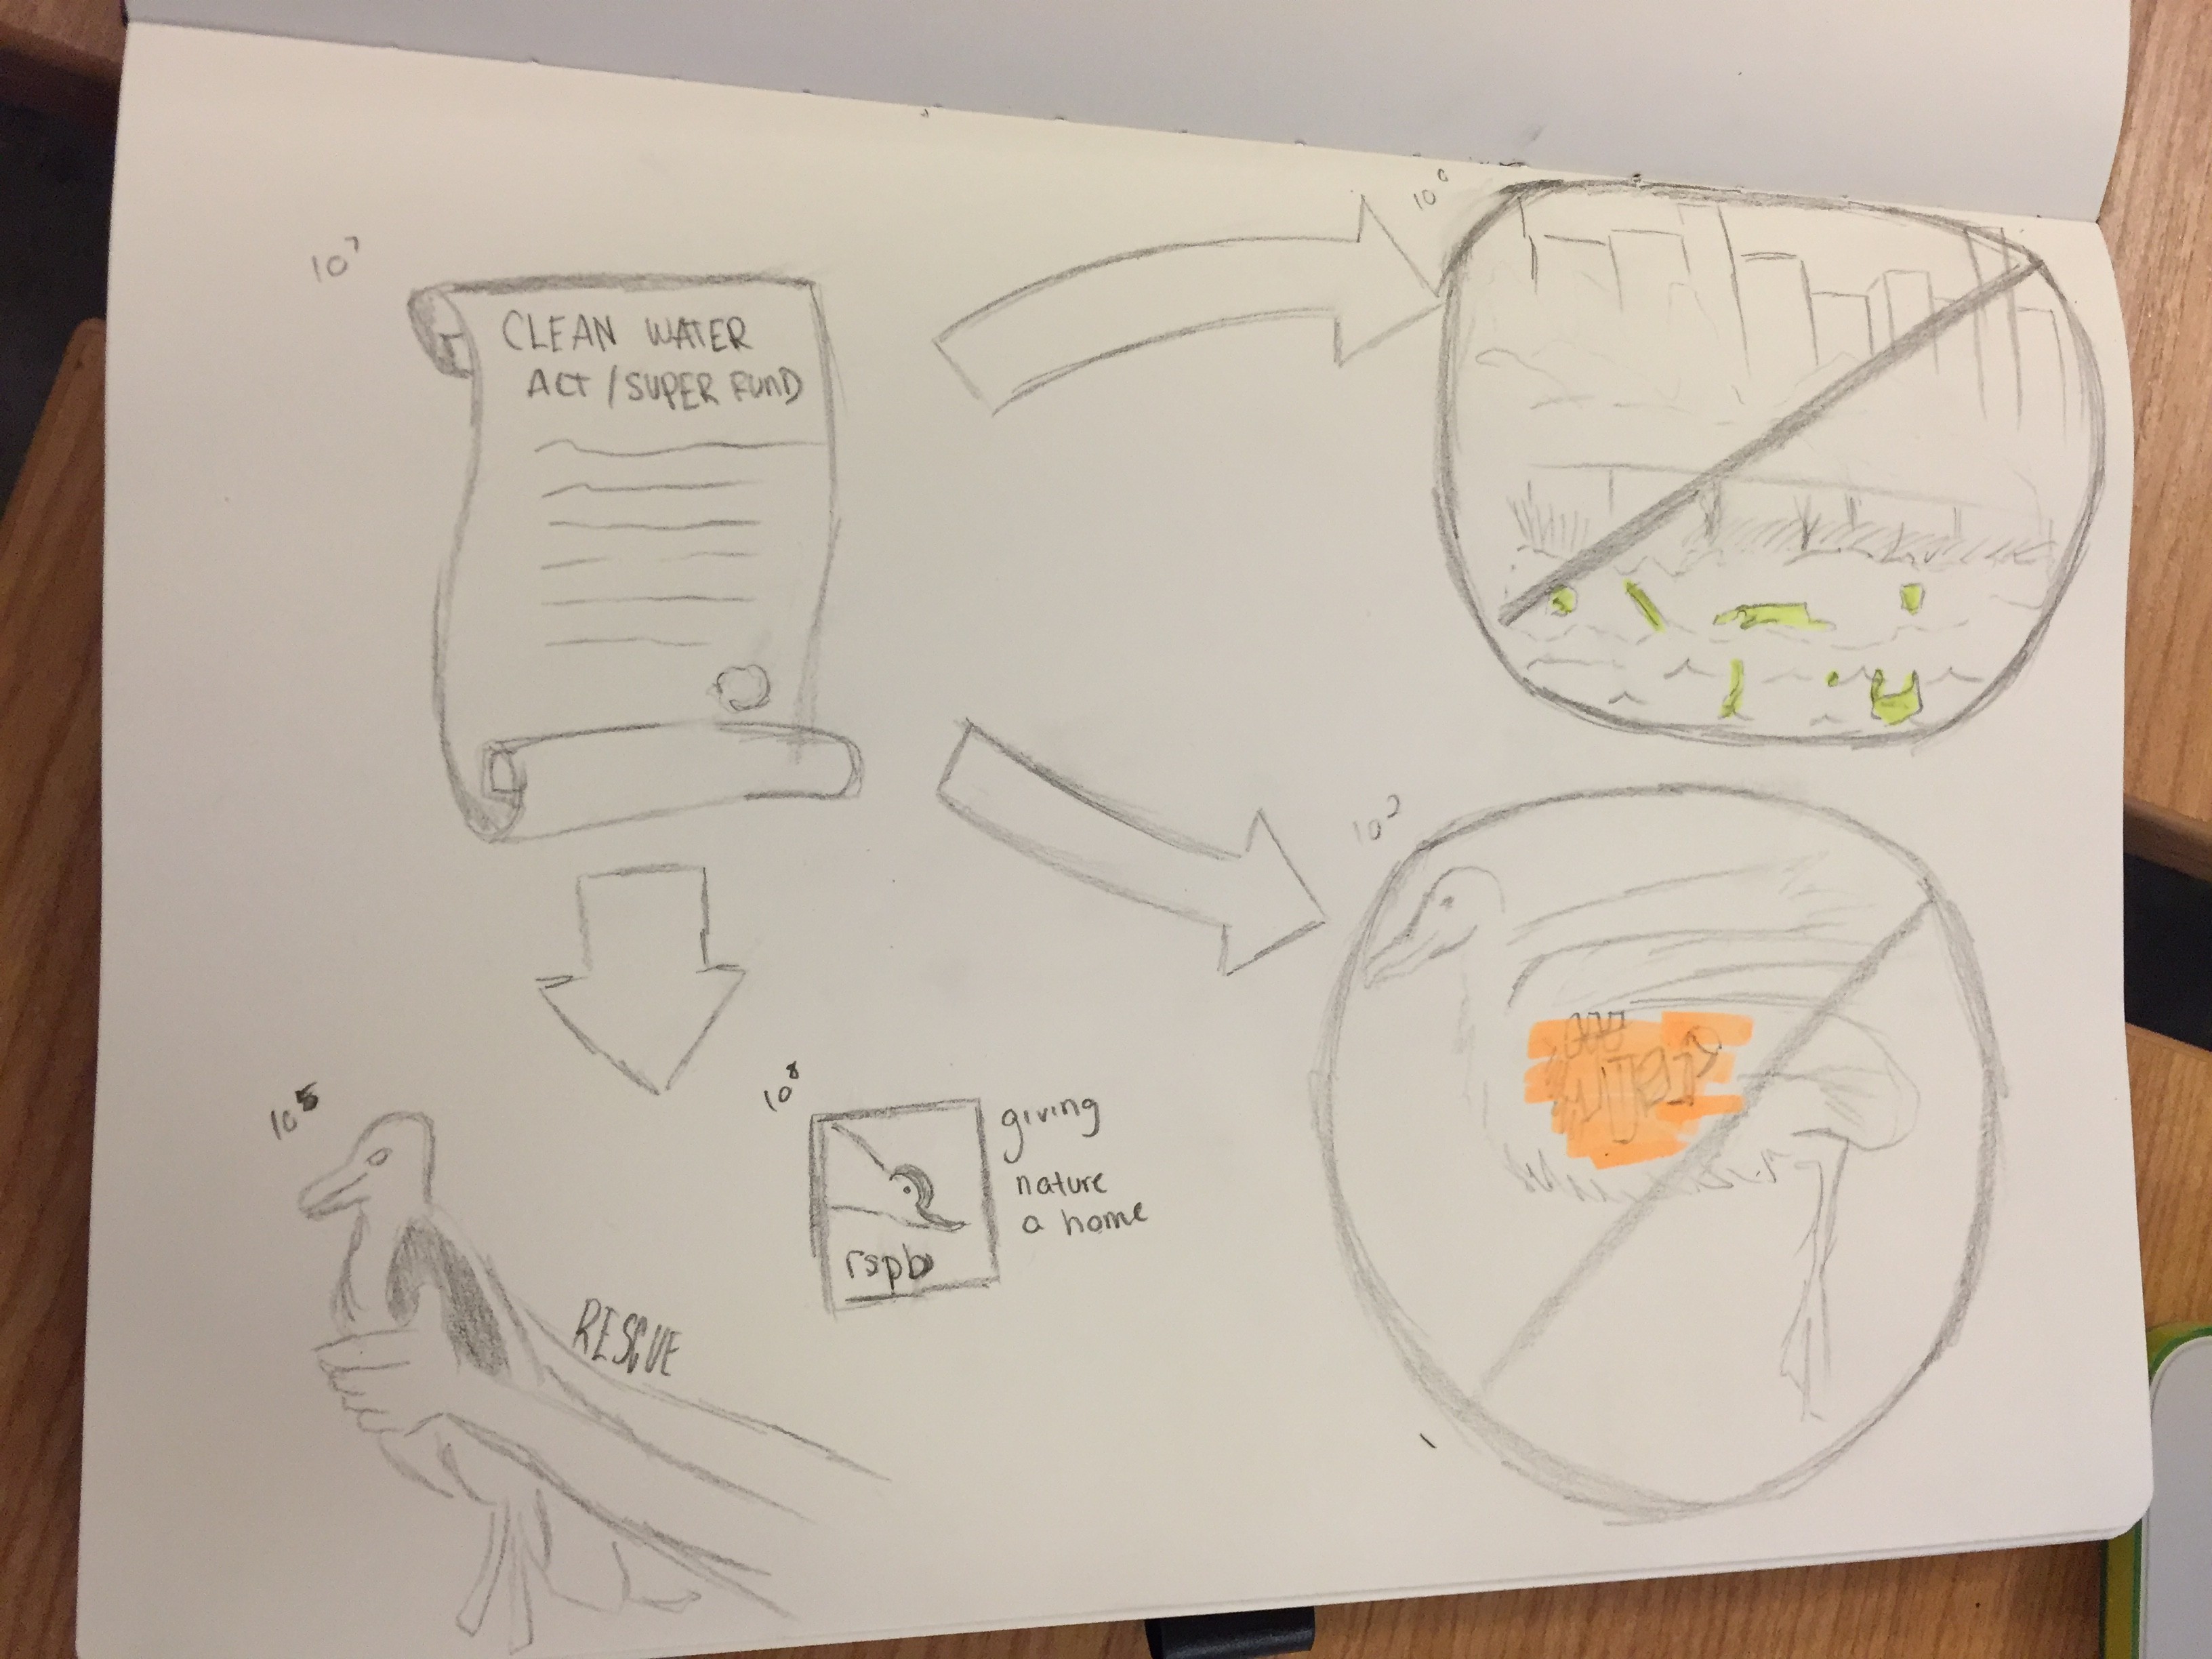
10^7 – illustrating a scroll that represents both the CWA and the Super Fund
10^5 and 10^8 – The first part of the drawing shows animal rescue trying to save the endangered birds from their dying natural habitat. The second part is the logo for the Royal Society for the Protection of Birds which is an organization that serves to try and preserve these birds. This is to prove with the help of many individuals, the birds have a potential at flourishing once again.
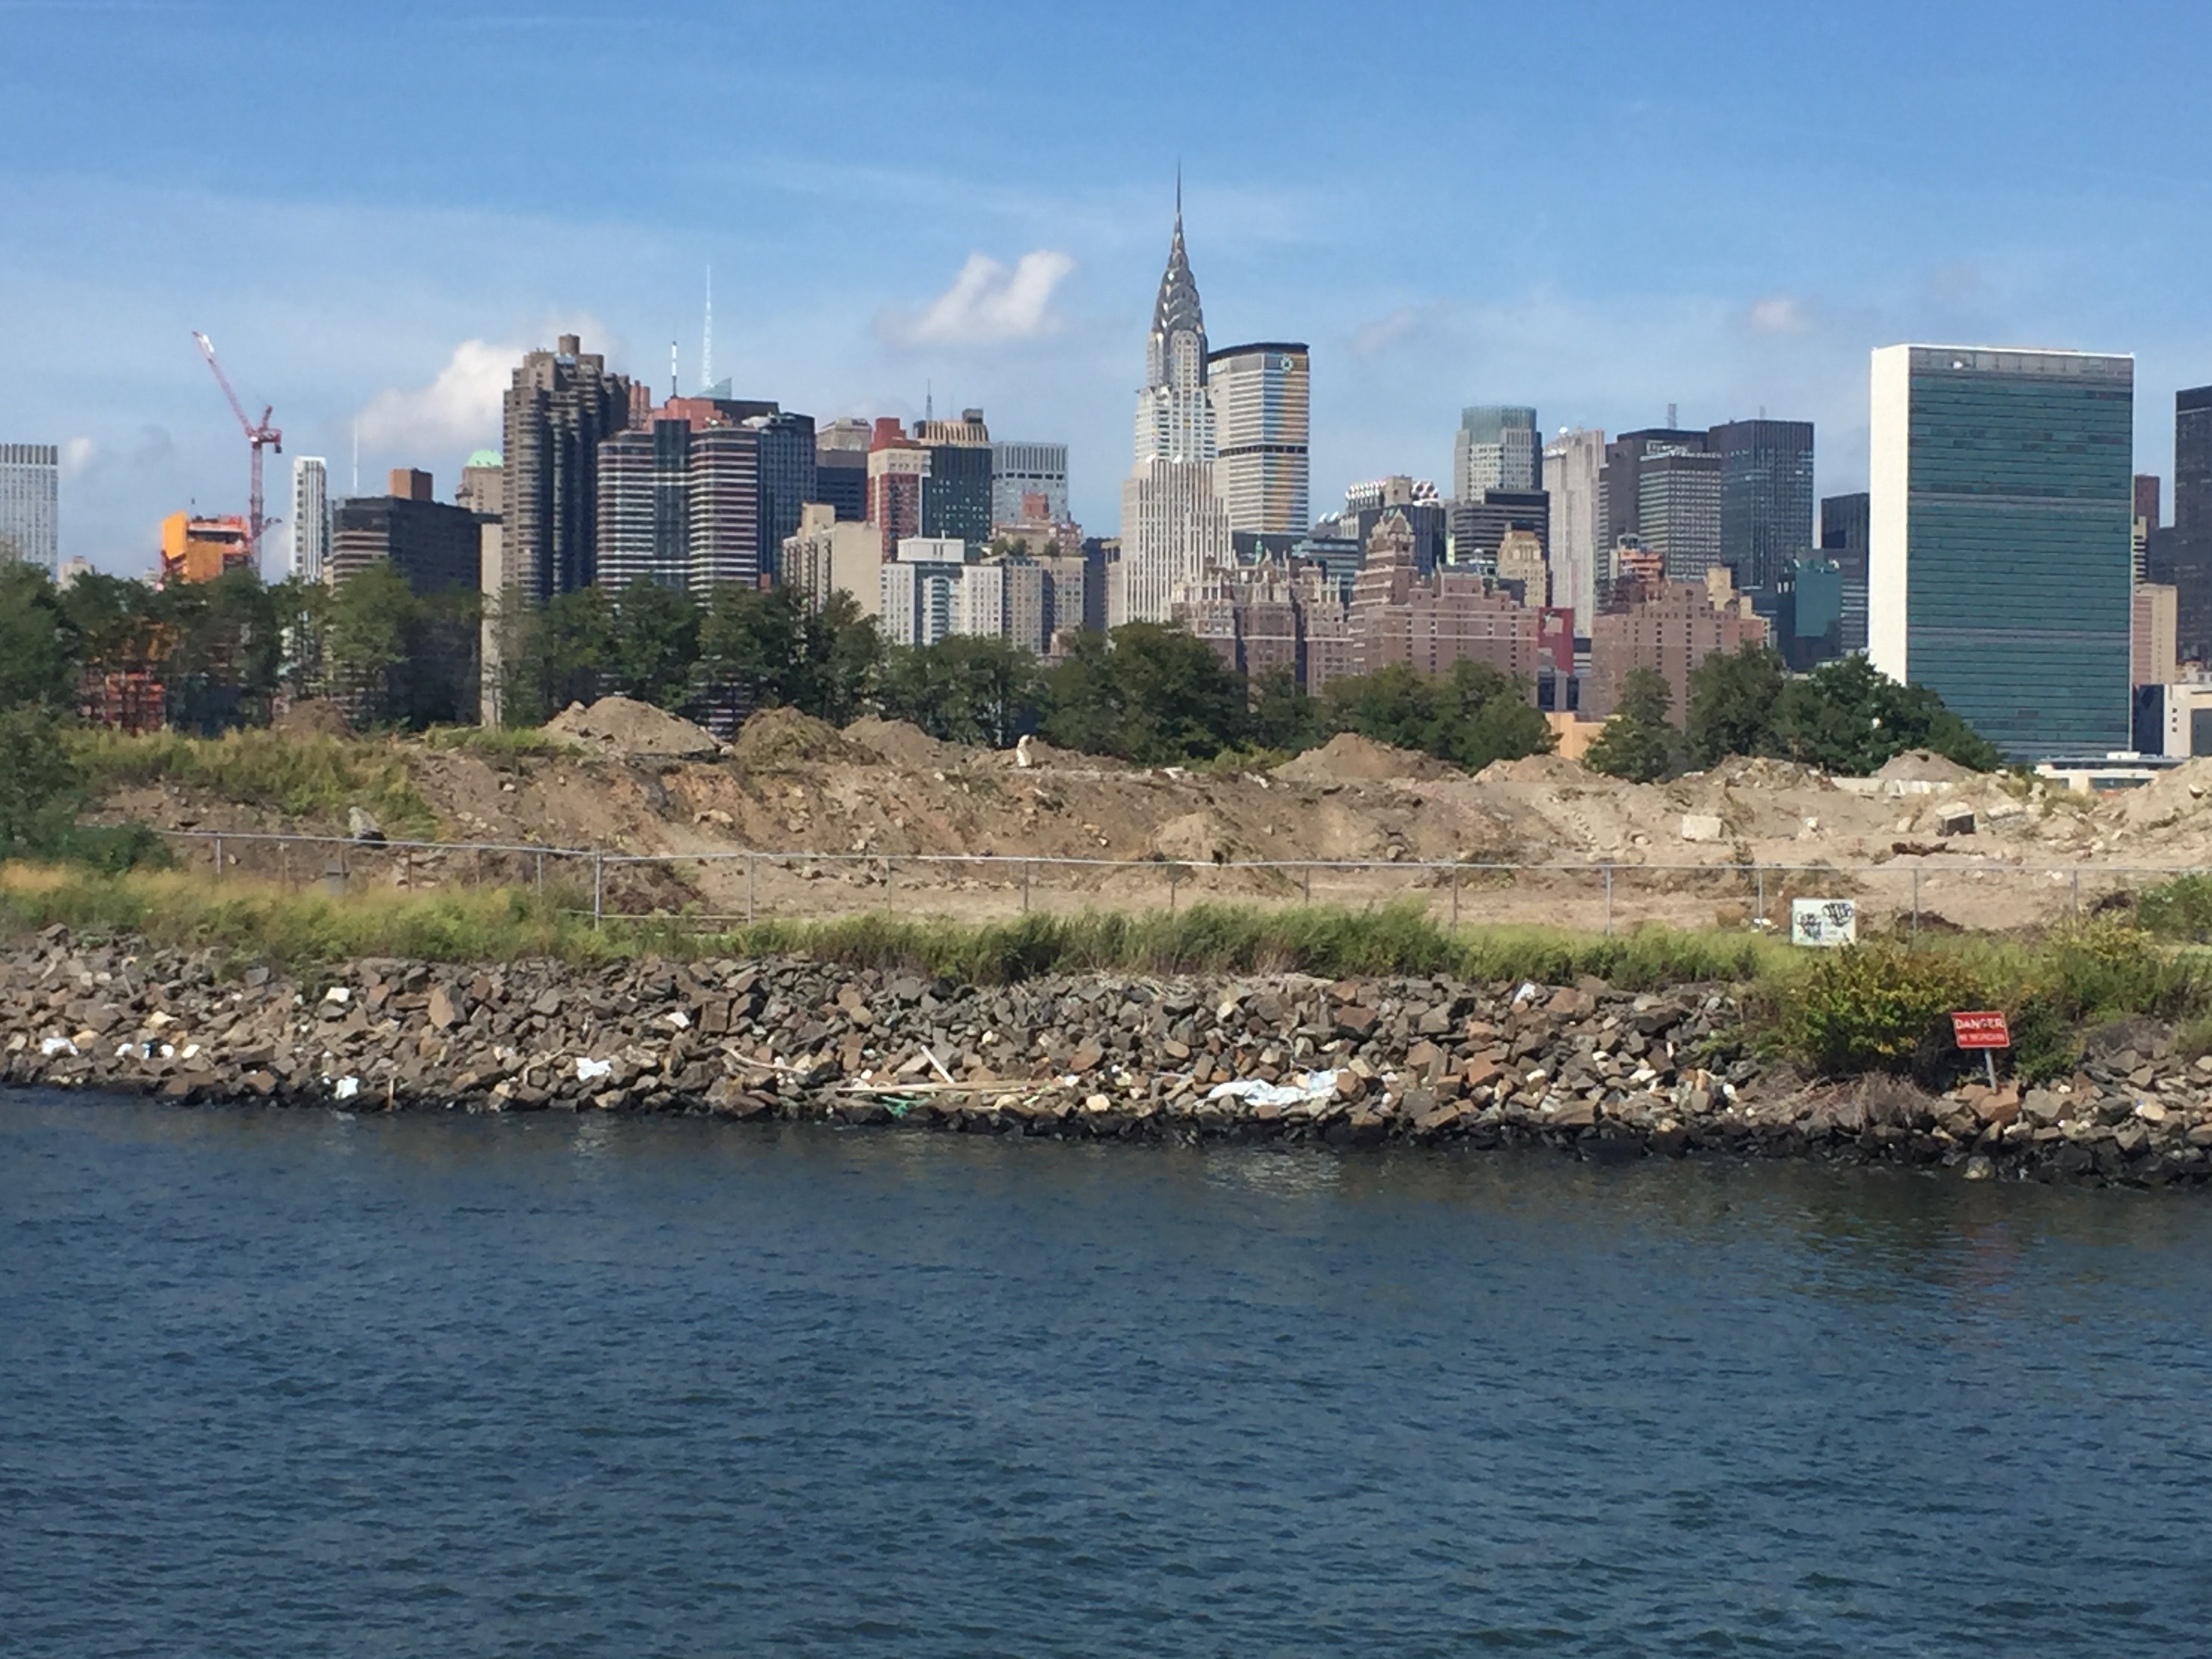
10^0 – Both the Act and the Fund point towards a scene we saw on the boat ride. This is a sketch of when the boat explored the landfill at Newton Creek. At the shoreline there were plastic bags scattered on the rocks and other waste floating in the water. I wanted to display that the Act and Fund were made to regulate these forms of waste and prevent this from further occurring.
10^-2 – This next scale also shows something the Act and Fund were made to prevent. I wanted to depict how the polluted water affected the Albatross birds by drawing one bird with it’s stomach filled with the plastics it eats.
Powers of Ten for Water Datasheet <– Click for excel sheet diagram